Overview
In this study, we focused on testing whether the entropy-driven circuit could function in combination with a DNA hydrogel. Specifically, we did not integrate the aptamer-based bacterial recognition module; instead, we directly added the Output DNA produced by the circuit to the hydrogel solution to experimentally determine whether it could induce hydrogel dissolution.
The experimental procedure followed the flow diagram shown below.
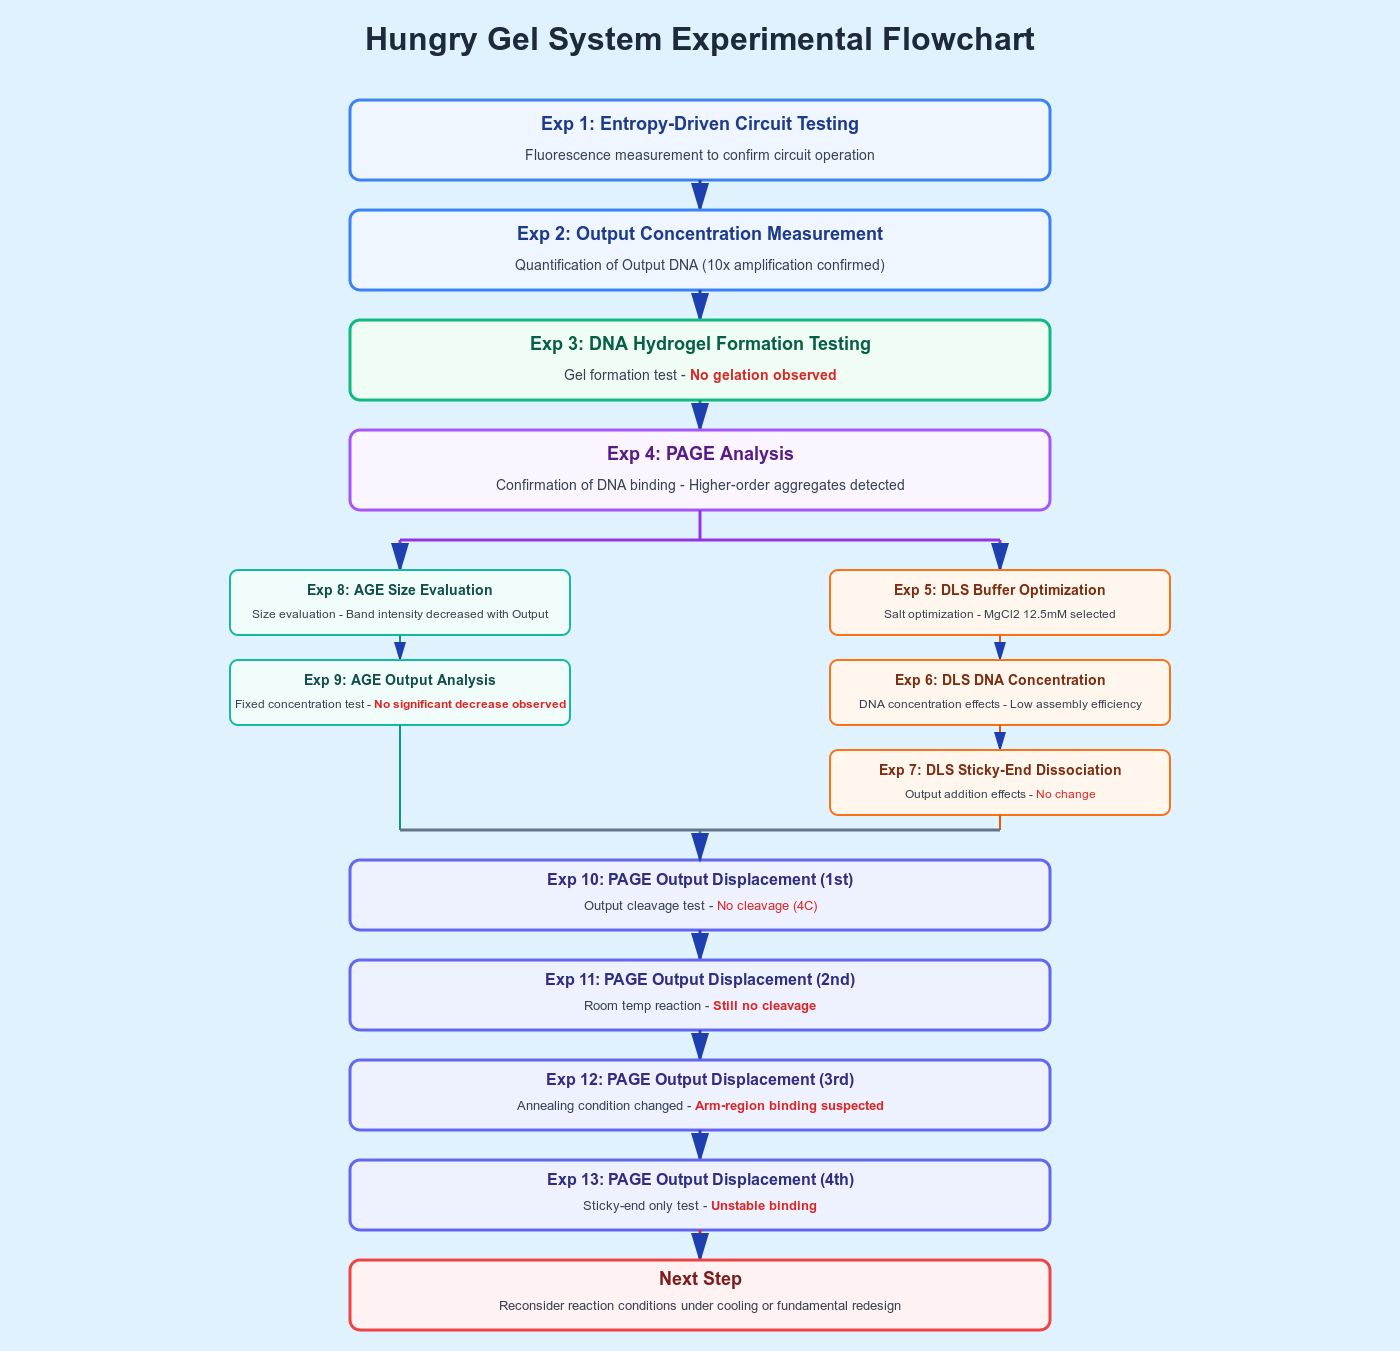
Figure 0. Experiment Flow
Experiment 1 : Entropy Driven Circuit Testing
Objective
To reproduce the DNA amplification by Entropy-Driven circuit
Method
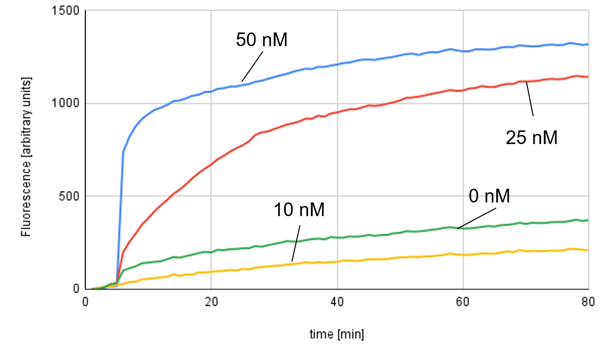
We compared four samples with different Catalyst concentrations. The Catalyst concentrations were adjusted to 50 nM (Sample #1), 25 nM (Sample #2), 10 nM (Sample #3), and 0 nM (Sample #4). Each solution also contained 20 nM of Substrate and 1000 nM of Fuel.
To detect the presence of the Output, we used a reporter molecule as illustrated below. When the Output strand is present, it binds to the reporter and triggers a strand displacement reaction. The reporter consists of a duplex of a fluorophore-labeled DNA strand and a BHQ-labeled quencher strand. Initially, fluorescence is quenched by the BHQ; however, when the strand displacement reaction occurs, the fluorophore-labeled strand is released, resulting in an increase in fluorescence intensity. The change in fluorescence intensity was monitored using real-time PCR (model number: CFX Opus 96), with measurements taken every minute for 80 minutes at a constant temperature of 25 °C.
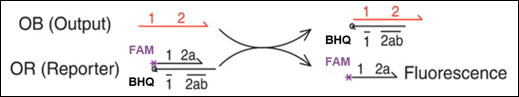
Figure 1a. Fluorescence Reporter System
Result
Figue 1b. Entropy-driven circuit result
The rate of increase in fluorescence intensity for the 50 nM sample slowed significantly after 10 minutes.On the other hand, under other conditions, the fluorescence intensity gradually increased throughout the measurement time. The result showed that amplification occurred more in the 0 nM condition than in the 10 nM condition.
However, focusing on the change over time, it can be seen that the fluorescence intensity increase in the 0 nM condition occurred at nearly the same time point as the 50 nM and 25 nM conditions, and the subsequent rate of increase was not significantly different from the 10 nM condition.
Therefore, it's possible the 0 nM and 10 nM samples were switched, but this isn't certain.
Nonetheless, the overall trend confirmed that a higher Catalyst concentration led to a faster Output generation rate and a higher final Output concentration. Thus, we concluded that the literature results were generally reproducible and decided to proceed to the next experiment."
Next Step
Since this experiment relies on fluorescence intensity measurement, and the final Output concentration is unknown. Then,the next step will be to perform a quantitative measurement of the Output concentration.(Experiment 2)
Experiment 2 : Entropy Driven Circuit Output Concentration measurement
Objective
To quantitatively measure the concentration of the Output generated by the entropy driven circuit.
Method
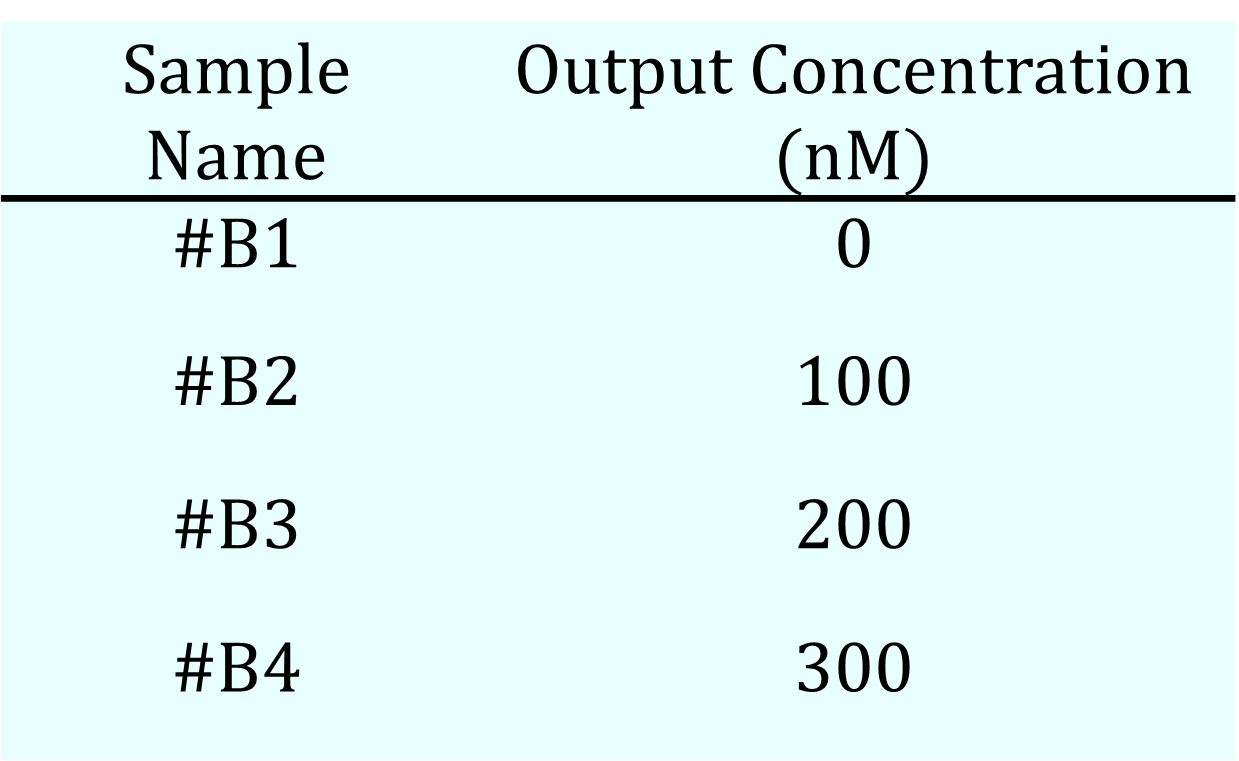
We prepared 10 types of samples under the following conditions.
#A Group(Different in Catalyst Concentration, n=6)
- Substrate: 300 nM
- Fuel: 390 nM
- Reporter: 900 nM
- Buffer: 12.5 nM (MgCl₂)
- Catalyst: concentration was varied as shown in Table 2a
#B Group(Different in Output Concentration, n=4)
- Reporter: 900 nM
- Buffer: 12.5 nM (MgCl₂)
- Output: concentration was varied as shown in Table 2b
We used the reporter shown in Fig.1a. Fluorescence measurements were performed using real-time PCR (model number: CFX Opus 96), similar to Experiment 1. The measurement conditions were set to 25°C, with a 1-minute interval for 200 minutes.
Table 2a. Catalyst Concentration
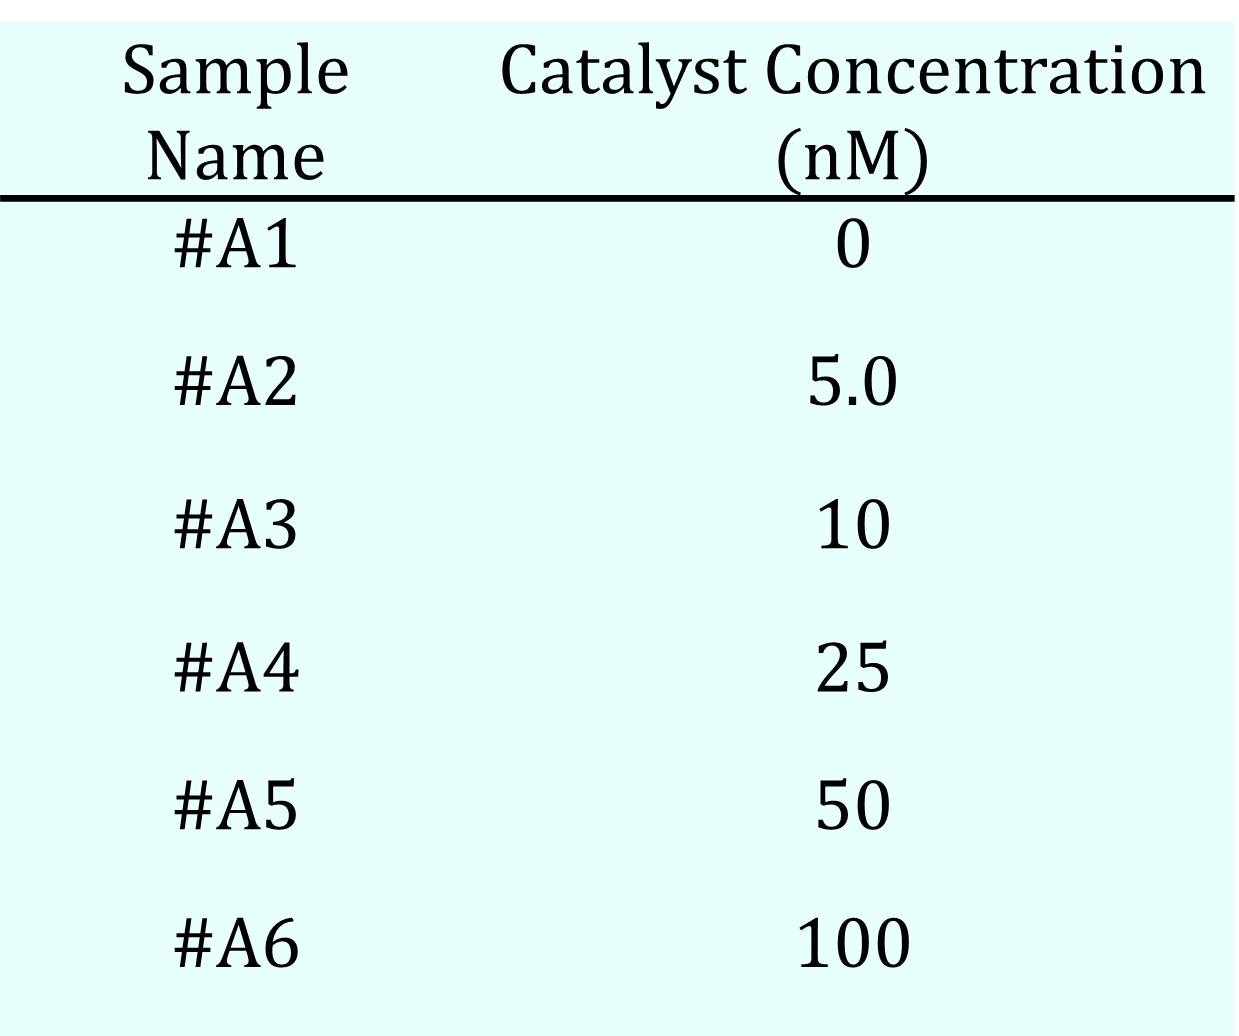
Table 2b. Output Concentration
Result
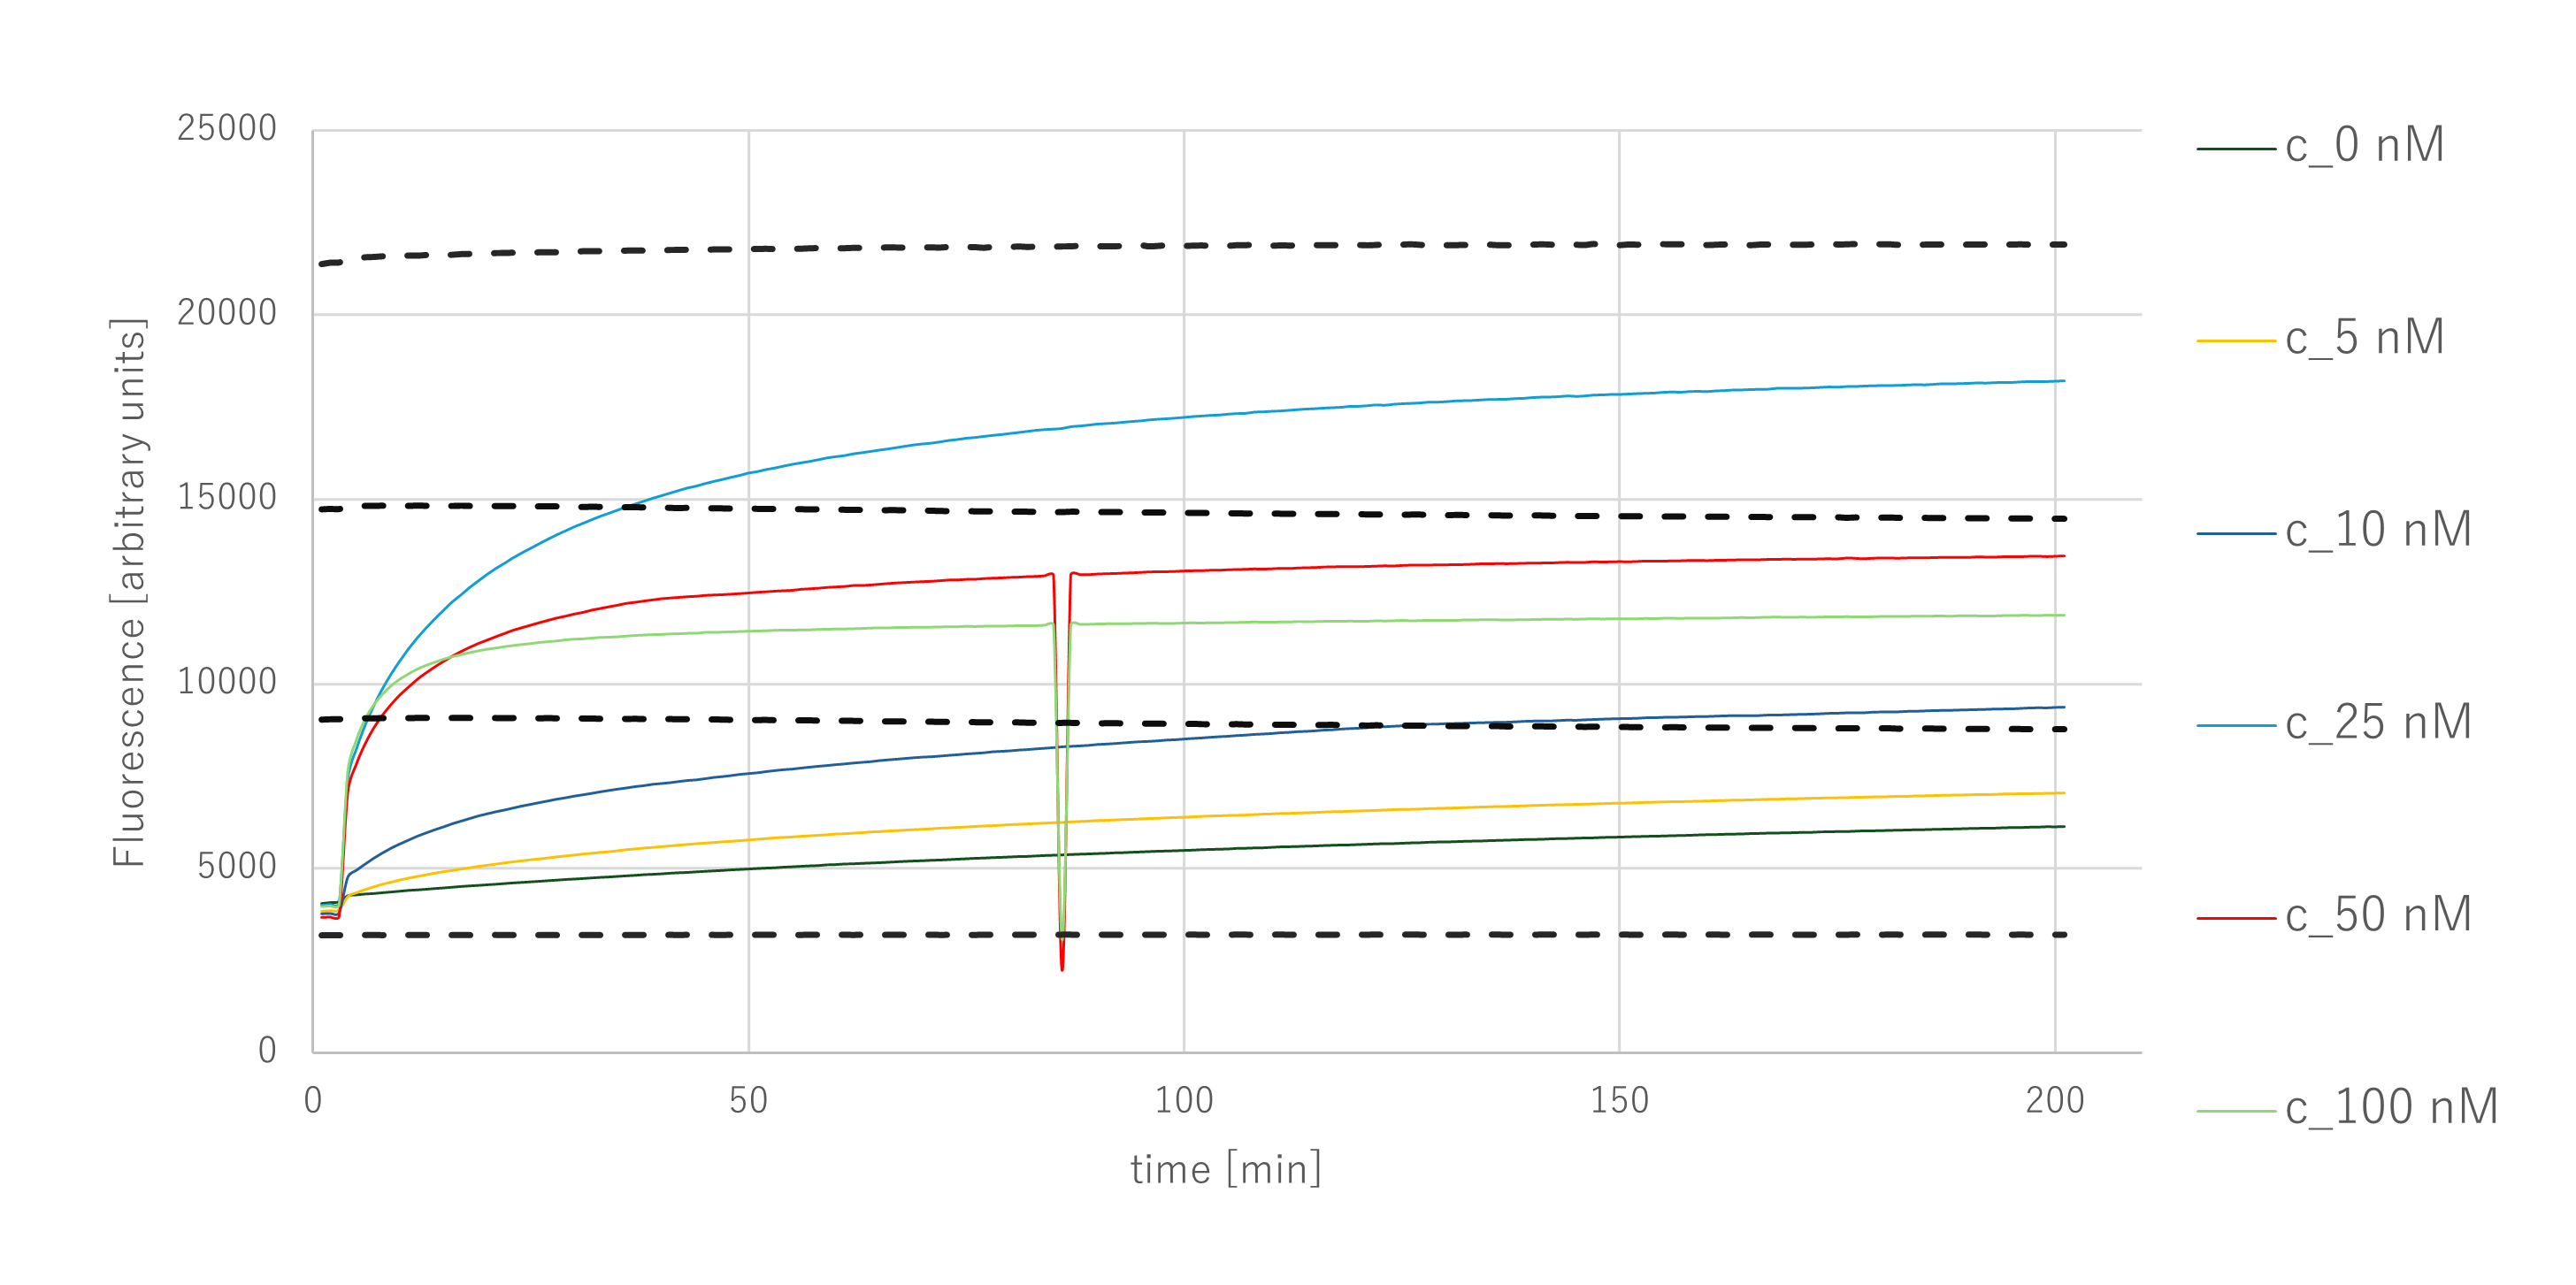
Figure 2a. Output Concentration Result
Since the Output sequence is included within the Substrate, the maximum possible Output concentration in this experiment is equal to the Substrate concentration, i.e., 300 nM.
The fluorescence intensity increased as the Catalyst concentration rose from 0 to 25 nM, but decreased at higher concentrations. Focusing on the sample with a Catalyst concentration of 25 nM, which exhibited the strongest fluorescence signal, the fluorescence intensity corresponded to an Output concentration between 200 nM and 300 nM.
In addition, the fluorescence intensity increased rapidly up to approximately 60 minutes and continued to rise gradually thereafter. A noise spike was observed around 85 minutes, which was likely due to an instrument error; since no change in the data trend was observed after the noise event, the measurement itself was considered reliable.
From these results, it was confirmed that the entropy-driven circuit achieved an amplification rate of approximately tenfold.
Next Step
In Experiments 1 and 2, we verified the functionality of the entropy-driven circuit and quantitatively assessed its amplification efficiency. Subsequently, we proceeded to DNA hydrogel formation experiments to examine whether the designed sequences could successfully assemble into gels. (Experiments 3 and onward.)
Experiment 3 : DNA Hydrogel Formation Testing
Objective
To confirm that a DNA hydrogel is formed with the designed sequences.
Method
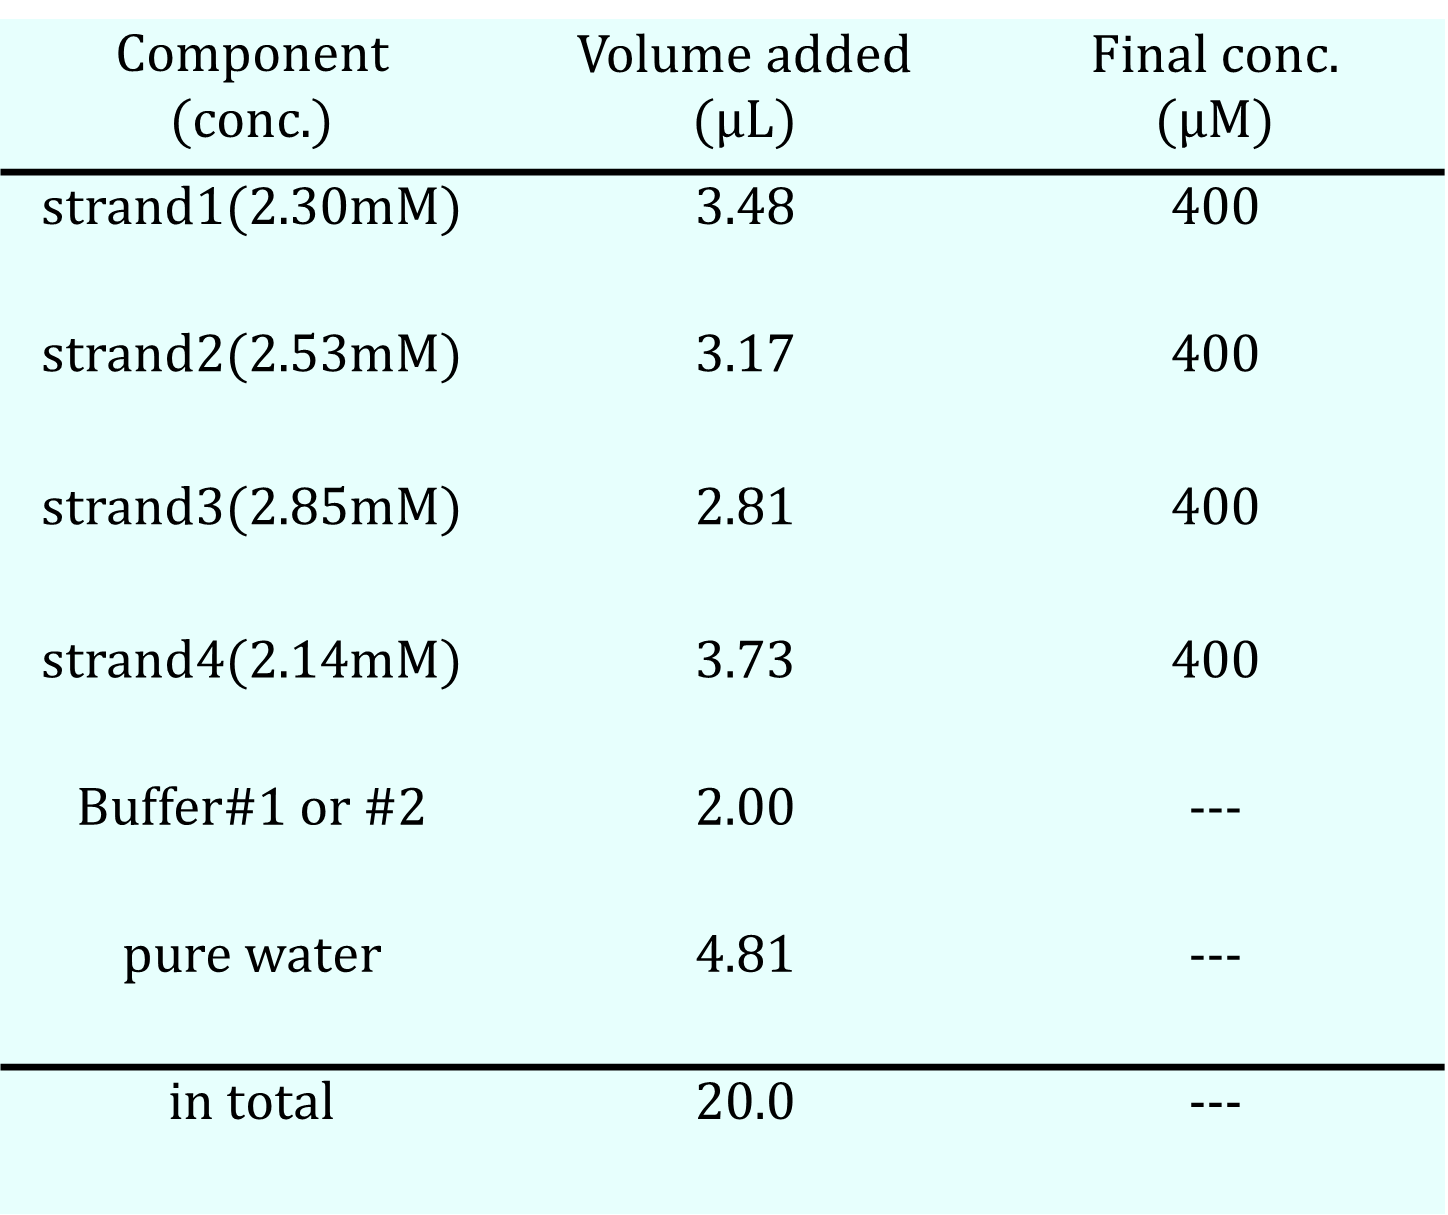
We prepared two types of buffer solutions: one containing MgCl₂ (Buffer #1) and another containing NaCl (Buffer #2), as shown in the table below. The concentrations of the DNA sequences for the hydrogel, as indicated in the Design Appendix, were set to 400 μM, and the total volume of the solution was adjusted to 20 μL by mixing four DNA solutions with buffer solutions and pure water. After allowing the mixed solutions to stand in the refrigerator, their states were checked by pipetting. Additionally, the same solutions underwent an annealing process, starting at 95°C for 5 minutes, followed by a decrease of 1°C per minute until reaching 4°C.
Table 3a. Buffer#1 Recipe
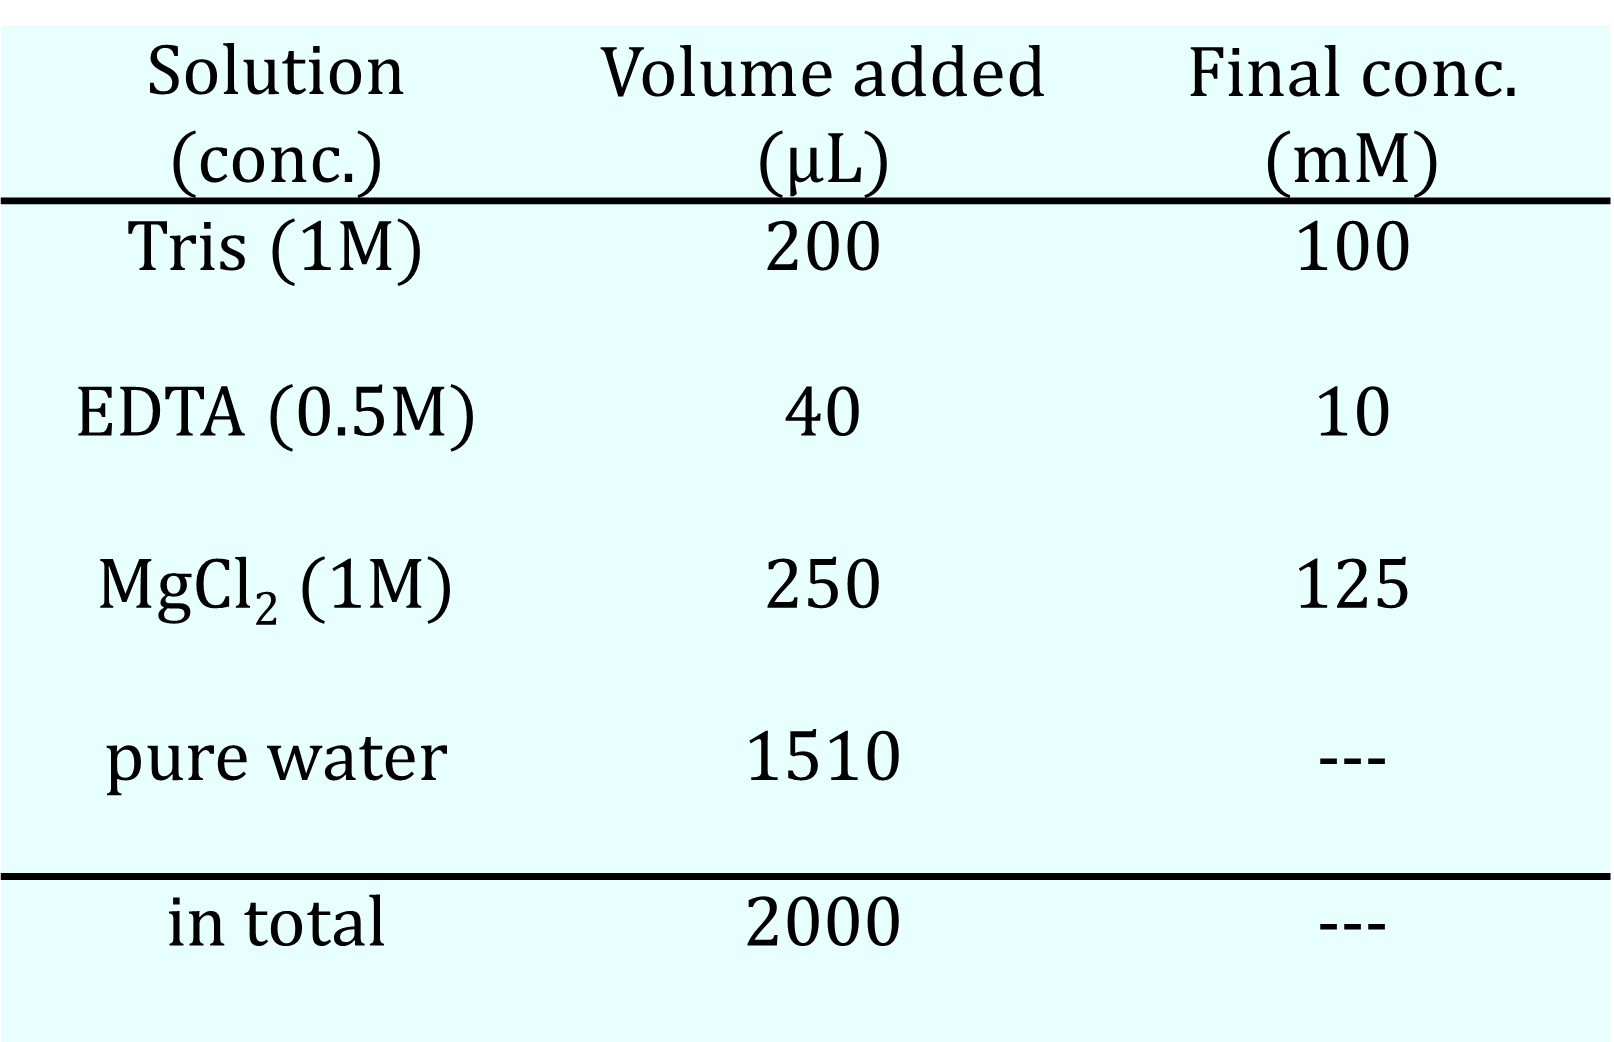
Table 3b. Buffer#2 Recipe
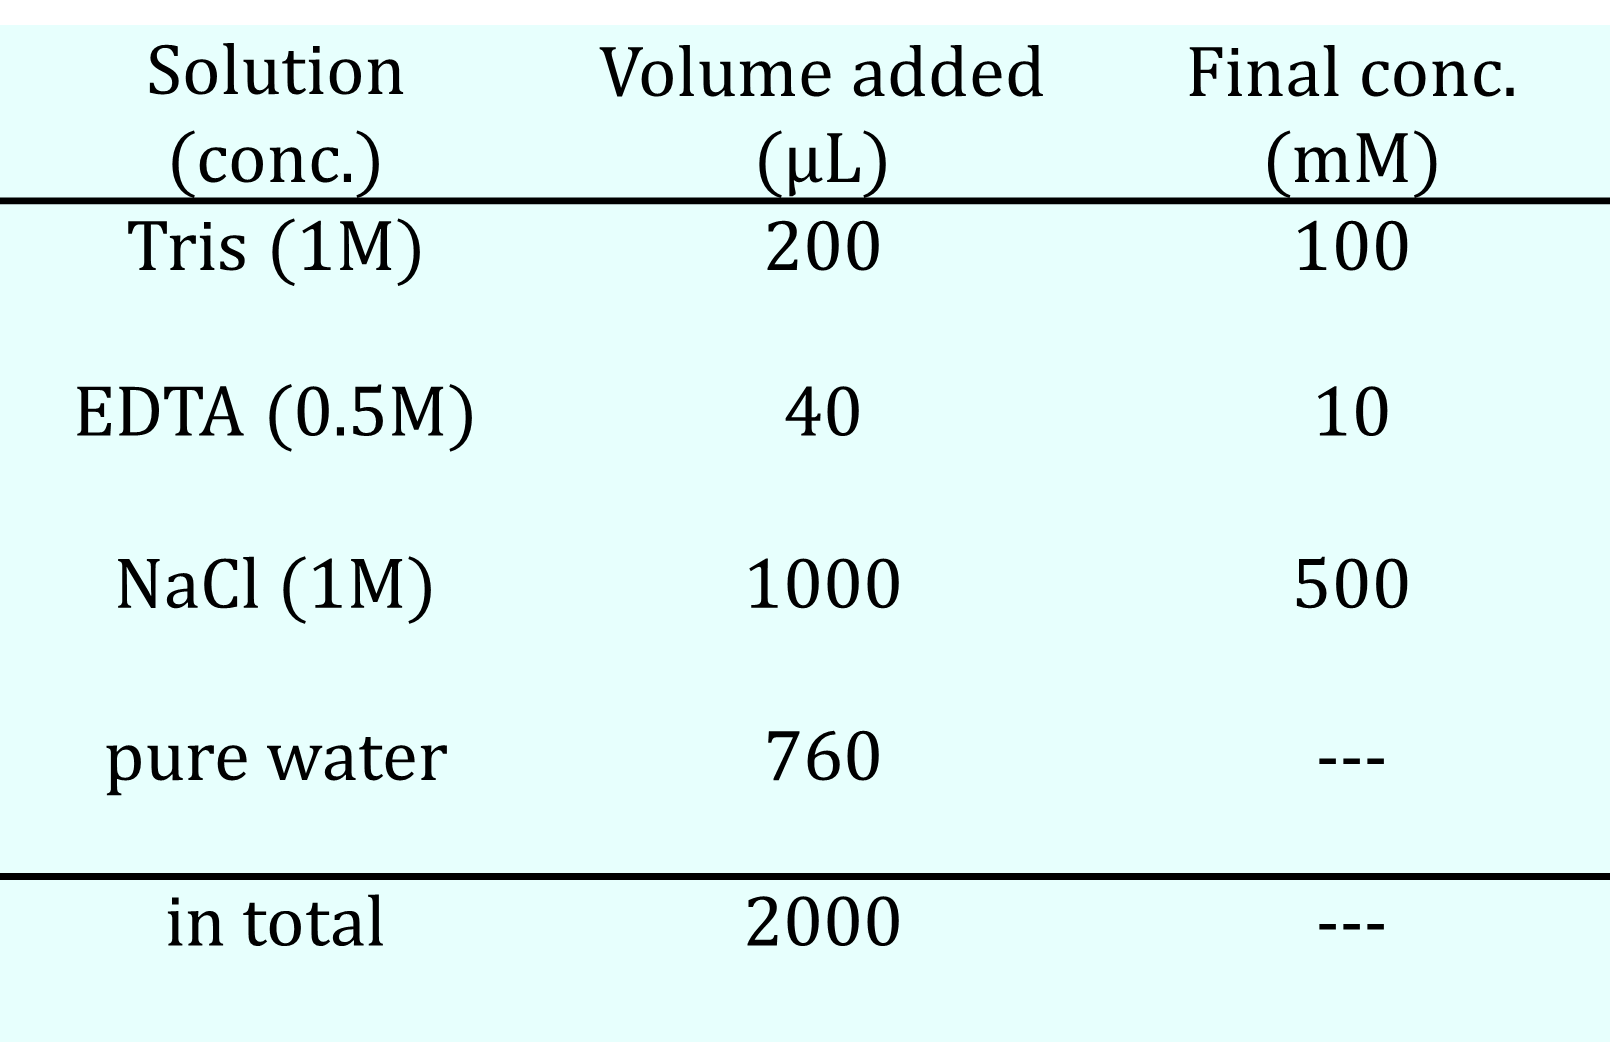
Table 3c. Solution Recipe
Result
For both Buffer #1 and Buffer #2 solutions, the samples were gently pipetted after refrigeration and annealing to qualitatively assess gel formation. Under all conditions, no signs of gelation were observed. In addition, microscopic observation of the solutions after annealing revealed no detectable structures at the microscale.
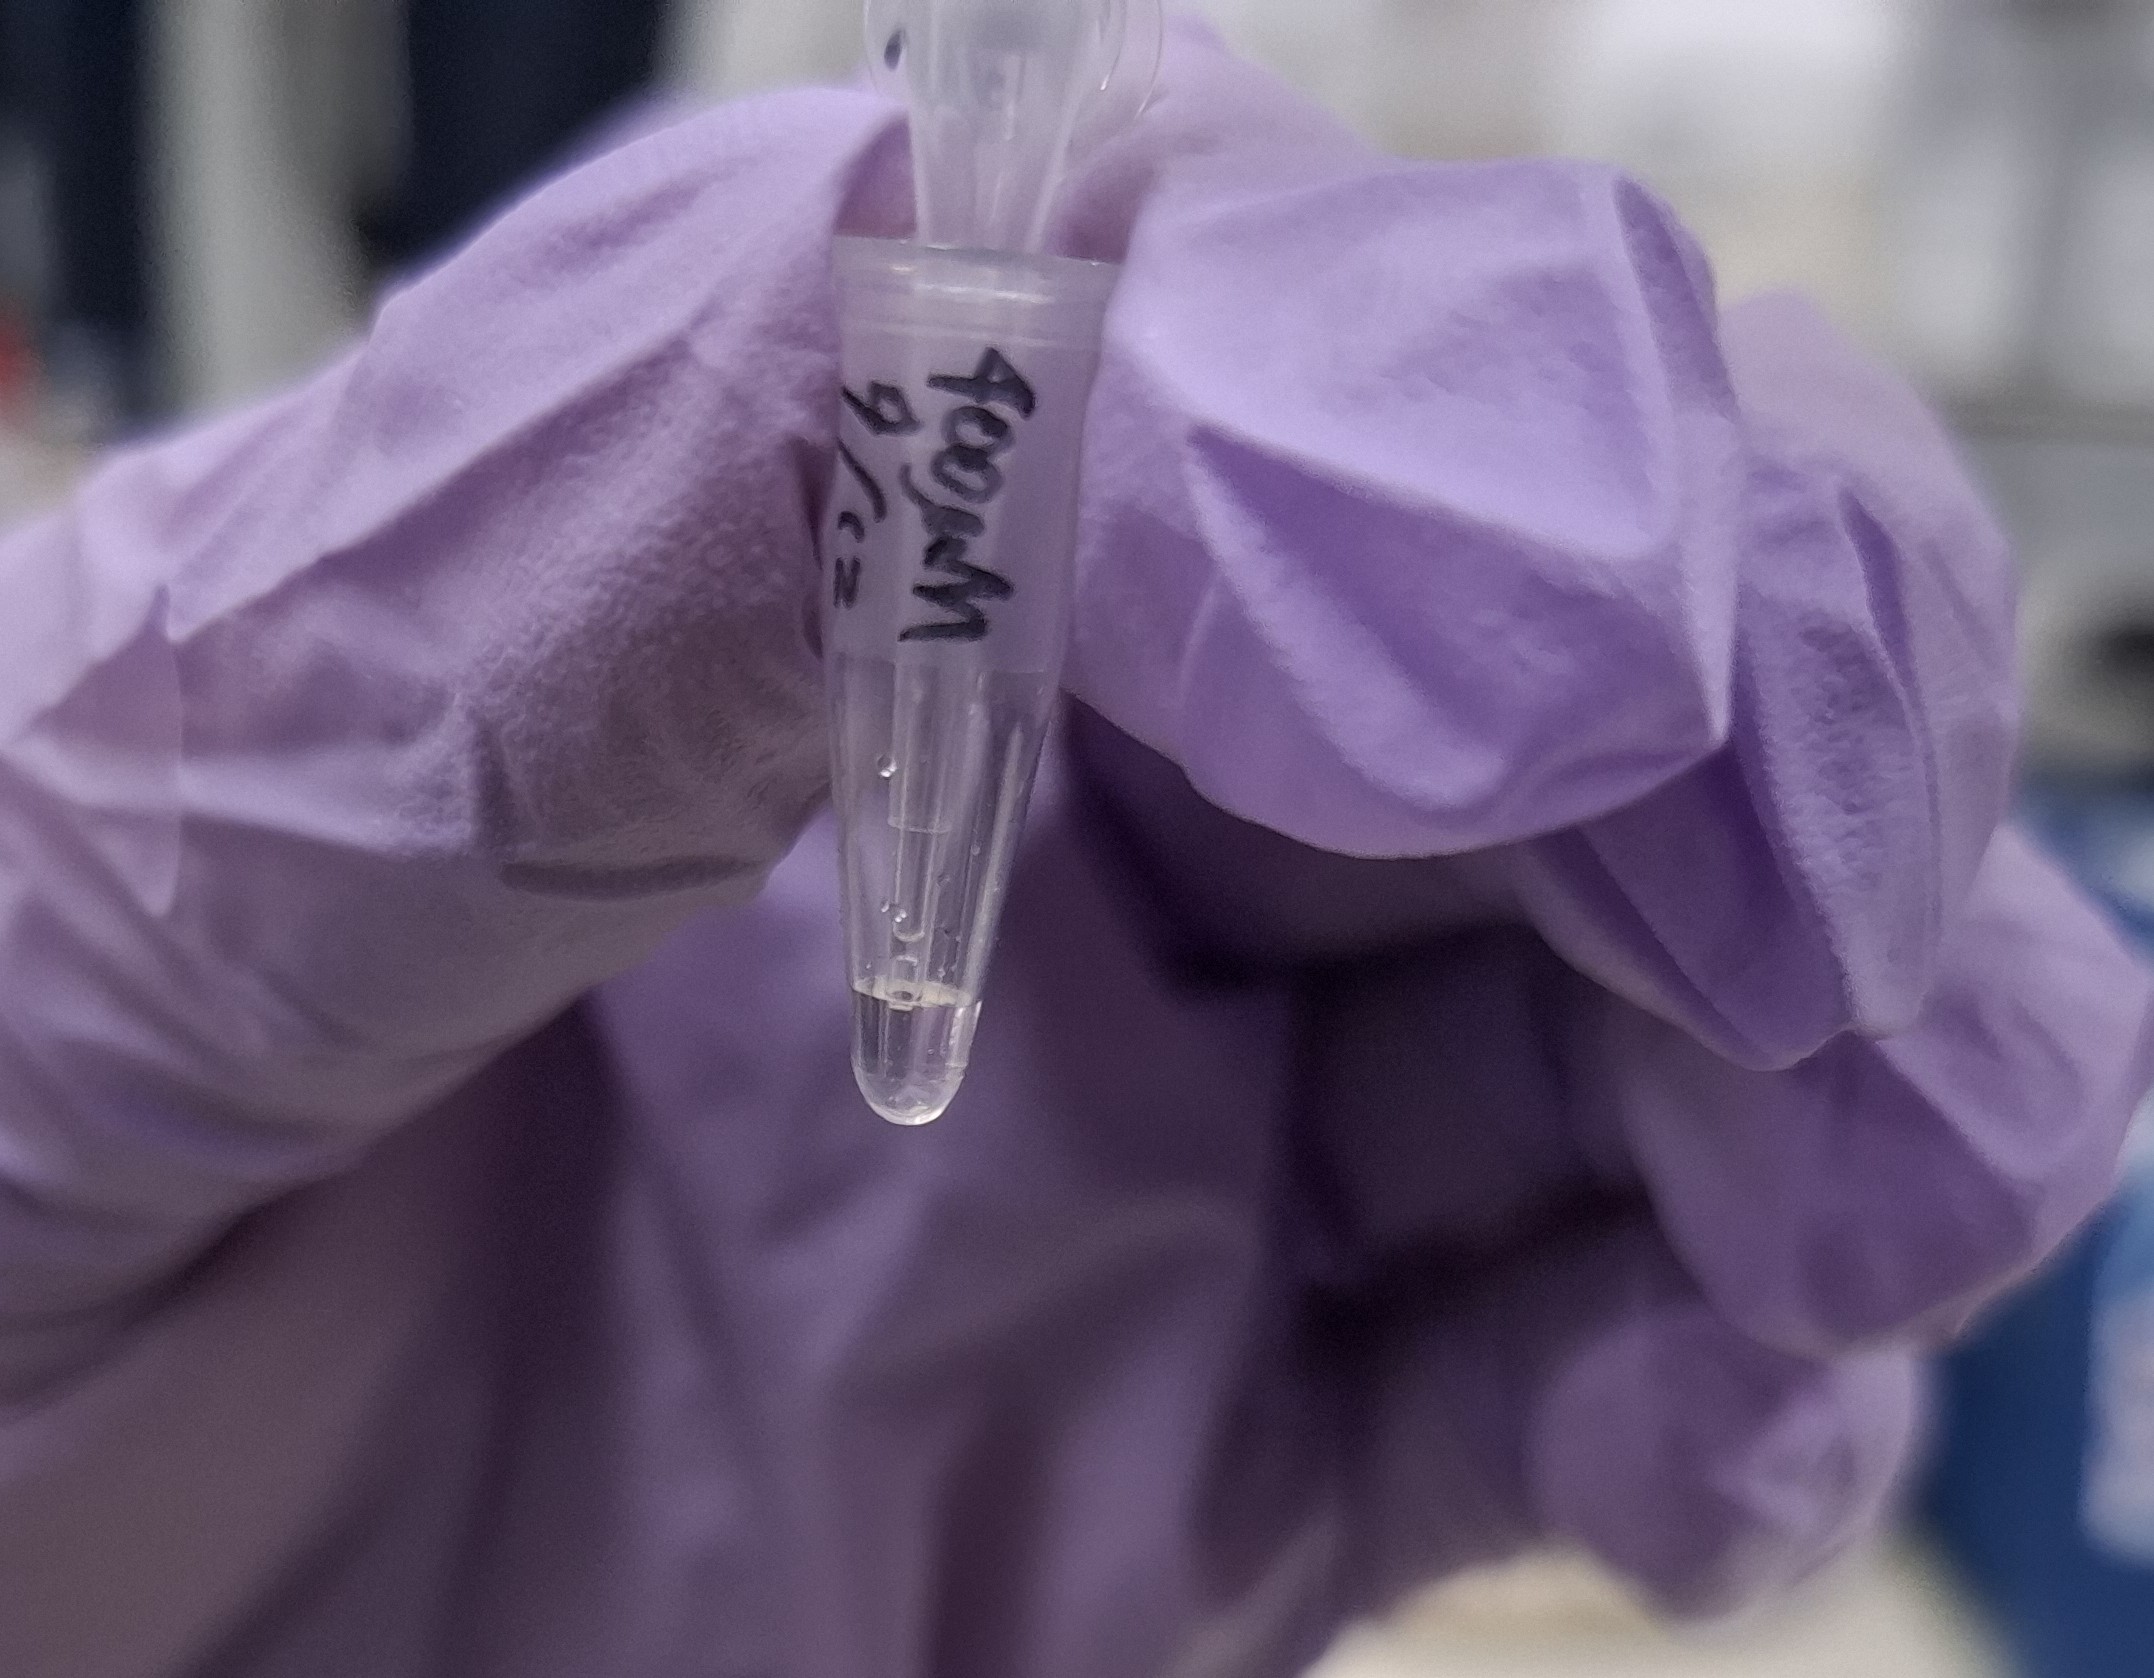
Figure 3a. No gel formation observed after annealing (MgCl₂ buffer)
Next Step
Although the mixed solution remained in a liquid state without gelation, macroscopic observation alone could not determine whether molecular-level interactions had occurred. Therefore, as the next step, electrophoresis was performed to analyze the system at the molecular level (Experiment 4). In addition, since only one concentration was tested for each of the two buffer types in this experiment, we next examined how changes in buffer concentration affected the system (Experiment 5).
Experiment 4 : Investigation of the Cause of Failure by PAGE(Polyacrylamide Gel Electrophoresis)
Objective
To investigate the interactions between DNA sequences in solution and identify the cause of the failure in gel formation.
Method
In this electrophoretic analysis, we investigated which combinations of four DNA strands (designated as strand 1, 2, 3, and 4) would form duplexes or higher-order structures. For this purpose, a total of 16 sample solutions, representing all possible combinations, were prepared as shown in the results (Fig. 3a). A 20 bp DNA Ladder was used as a size reference. In each solution, the concentration of each DNA strand was 200 nM, and the sodium ion (Na⁺) concentration was 50 mM.
A 10% polyacrylamide gel, polymerized with 0.1% TEMED and 0.1% APS, was prepared. The sample solutions were loaded into the wells of the gel, and electrophoresis was conducted at a constant voltage of 100 V for 1 hour. Following electrophoresis, the gel was stained with SYBR Gold, and the mobility of the bands was observed under UV illumination.
Figure 4a. PAGE Setup
Result
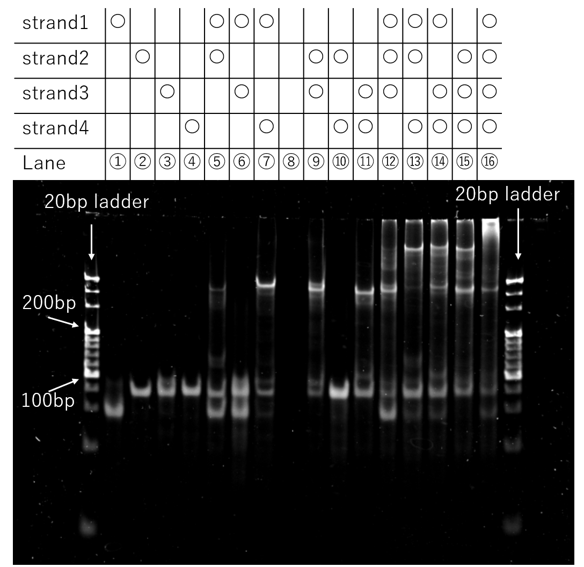
Figure 4b. PAGE Result
As illustrated in Fig.4b, in the solution containing all four strands (Strand 1, 2, 3, and 4), a band was observed at a position with significantly lower electrophoretic mobility than the largest fragment (300 bp) of the 20 bp DNA Ladder used for reference. This suggests that a higher-order assembly, composed of multiple motifs, was formed.
Furthermore, in the solutions containing two different strands, the combinations of non-complementary pairs (1 and 3; 2 and 4) exhibited bands at the same positions as their single-strand counterparts. In contrast, the combinations with complementary sequences produced an additional band at a higher position (i.e., lower mobility) than the single-strand bands. These results confirm that the designed DNA sequences hybridized as intended.
However, the fluorescent band from the four-strand mixture was concentrated near the loading wells at the top of the gel, indicating that its size exceeded the separation limit of polyacrylamide gel electrophoresis (PAGE). This implies that the molecular weight of the formed assembly was beyond the resolution range of the PAGE system.
Next Step
To conduct a more detailed analysis of the assembly size, we determined that the following two approaches, focusing on quantitative measurement and appropriate scaling, are necessary:
- 1: Agarose Gel Electrophoresis(Experiment 8) :Agarose gel electrophoresis, which is suitable for the separation of molecules with higher molecular weights, will be employed. This will allow for a qualitative comparison and analysis of the assembly size on a more appropriate scale than PAGE.
- 2: Dynamic Light Scattering (DLS) Measurement(Experiment5) :Since electrophoresis is limited to a qualitative analysis based on molecular mobility, Dynamic Light Scattering (DLS) measurements will be conducted in parallel. This will enable the quantitative evaluation of the actual molecular size distribution of the assemblies in solution.
Experiment 5 : Buffer Optimization by DLS (Dynamic Light Scattering)
Objective
To determine the optimal salt concentration in the buffer required for proper gel formation by varying its concentration.
Method
Ten types of samples (20 µL each) were prepared with different buffer salt concentrations under the specified conditions. After preparation, the samples were subjected to an annealing process, which involved heating to 95°C for 5 minutes, followed by cooling to 4°C at a rate of -1°C per minute. The particle size distribution of each sample was then measured using Dynamic Light Scattering (DLS). The DLS measurements were performed on a Zetasizer Ultra Red Label (model number: ZSU3305, Malvern Panalytical) at a constant temperature of 25°C. The measurement duration was set to "auto" for each analysis.
#A Group(Buffer salt is NaCl, n=5)
- DNA sequences of gel motifs (4 types): Each 400 μM
- Buffer: 100 mM Tris, 10 mM EDTA
NaCl concentration was varied from 12.5 to 80 mM across five conditions
#B Group(Buffer salt is MgCl₂, n=5)
- DNA sequences of gel motifs (4 types): Each 400 μM
- Buffer: 100 mM Tris, 10 mM EDTA
MgCl₂ concentration was varied from 6.0 to 60 mM across five conditions
Result
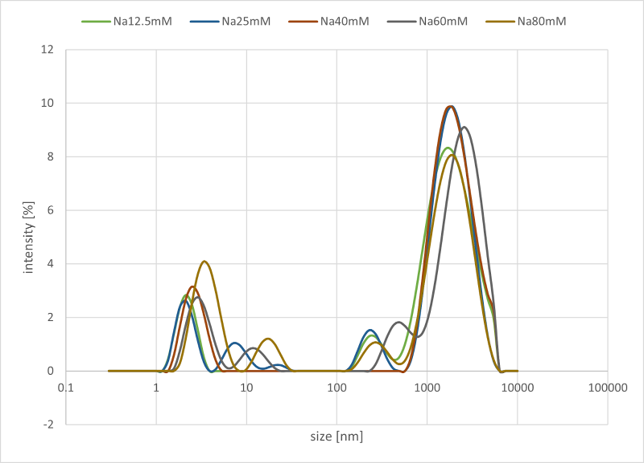
Figure 5a. Sample#A Result
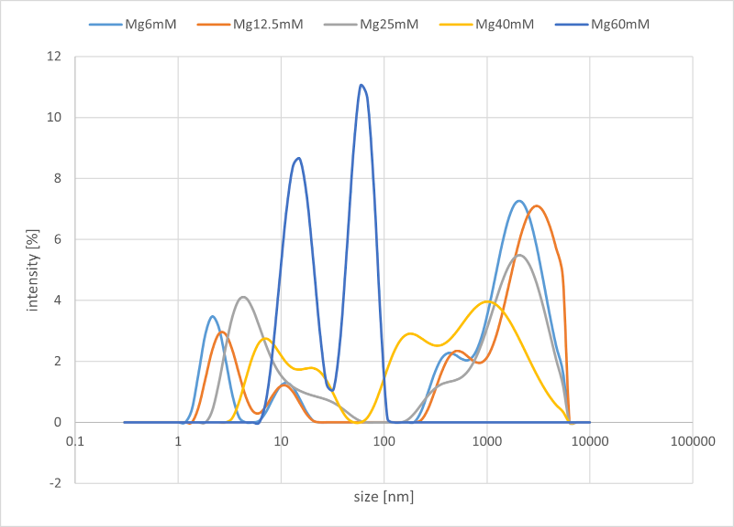
Figure 5b. Sample#B Result
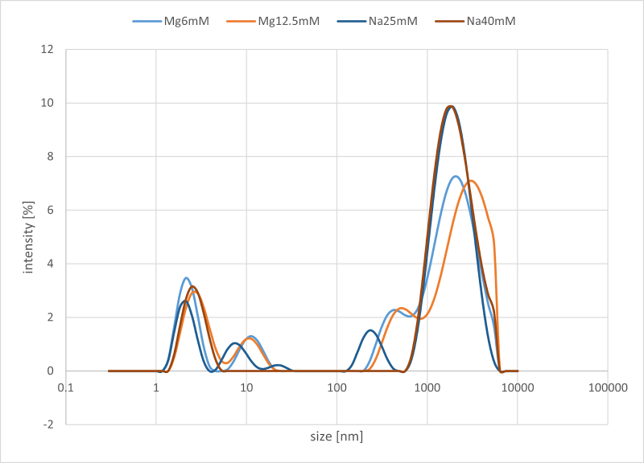
Figure 5c. DLS Buffer Optimization Result
As illustrated in the graph, a peak was observed in the range of 1000 nm to 10000 nm. In Group A, which used NaCl salt, no significant changes were observed in the peak intensity on the micrometer scale, even when the concentration was varied. In contrast, in Group B, which used MgCl₂ salt, it was confirmed that the peak intensity on the micrometer scale decreased as the salt concentration increased. Overall, changing the metal ion did not produce any significant differences in the characteristic peak positions or the overall trends.
From these results, it is presumed that structures on the order of several to tens of micrometers are being formed. Based on this outcome, we have decided to use MgCl₂ as the buffer salt at a concentration of 12.5 mM for this project. This decision is based on the fact that no significant differences in peak position or intensity were observed in the low concentration range, and that 12.5 mM corresponds to the optimal operating conditions for the entropy-driven circuit.
Next Step
As the next step, the size distribution will be evaluated at various DNA concentrations using DLS, an analysis that was not performed in the current experiment. (Experiment 6)
Experiment 6 : Analysis of DNA Concentration Effects by DLS(Dynamic Light Scattering)
Objective
To evaluate the particle size distribution of the hydrogel motifs at various DNA concentrations using Dynamic Light Scattering (DLS).
Method
We prepared five types of samples with different DNA concentrations, as shown in Table 6a. The samples for measurement were generally prepared to a final volume of 20 µL, with the exception of the 200 µM sample, which was prepared at 15.6 µL. The particle size distribution for each sample was subsequently measured using Dynamic Light Scattering (DLS). These DLS measurements were performed on a Zetasizer Ultra Red Label (Malvern Panalytical) at a temperature of 25°C, with the measurement duration set to "auto."
Table 6a. Sample Recipe
Result
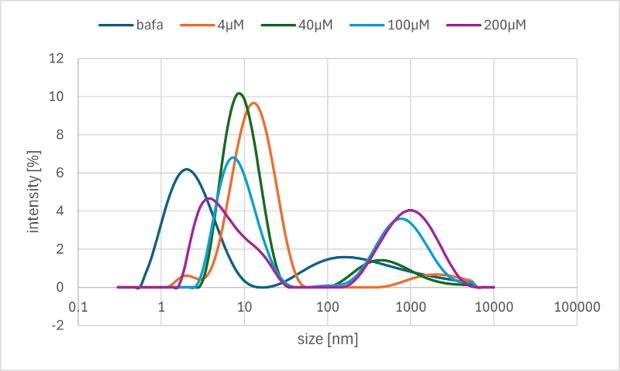
Figure 6a. DLS Result
As indicated by the data, in the low concentration range of 40 µM and below, peaks in the micrometer (µm) range were either not observed or exhibited low intensity. This suggests that structures on the micrometer scale do not form when the DNA concentration is low. Therefore, it is considered that a concentration of several hundred micromolars is likely necessary for the sequences designed in this project. However, despite the high concentrations used, the size of the resulting structures is relatively small, indicating that sufficient formation of higher-order structures commensurate with the concentration has not been achieved.
Next Step
The experimental results indicate a low assembly efficiency for the designed DNA motif sequences, suggesting that a re-evaluation starting from the sequence design stage is necessary.
Experiment 7 : Assessment of Sticky-Ends Dissociation using DLS
Objective
To determine whether the Output from the entropy-driven circuit can disrupt the bonds between the sticky ends of the hydrogel motifs.
Method
We prepared a total of six samples in two series, as detailed in Table 7a. The first series (Sample #A) consisted of samples that were annealed on the day of the experiment, while the second series comprised samples that had been annealed two days prior. The standard annealing protocol involved heating the samples to 95°C for 5 minutes, followed by cooling to 4°C at a rate of -1°C per minute.
In this experiment, Dynamic Light Scattering (DLS) measurements were conducted in two stages to compare the size of the initial structures, formed by the motif sequences alone, with their size after the addition of subsequent DNA strands.
First, a 16 µL "base solution" was prepared, consisting of the four gel motif sequences (80 µM each) in a buffer solution containing 12.5 mM MgCl₂, 10 mM Tris, and 1.0 mM EDTA. This base solution was annealed, and its initial molecular size distribution was measured by DLS.
Following the initial measurement, 4 µL of a solution containing either an Output strand or a Fuel strand was added to the 16 µL base solution, bringing the total volume to 20 µL. This dilution resulted in final concentrations of 64 µM for each gel motif sequence and 9.2 µM for the added DNA strand. The buffer concentrations remained constant throughout the experiment. The particle size distribution of this final solution was then measured again by DLS.
For Sample #B3, a time-course analysis was performed to monitor changes after the addition of the Output strand. DLS measurements were taken at three time points: immediately after addition (0 min), at 10 minutes, and at 20 minutes, to track the temporal evolution of the particle size distribution.
DLS measurements were conducted using the Malvern Panalytical Zetasizer Ultra Red Label, with a measurement temperature of 25°C and an auto setting for the measurement duration.
Table 7a. Sample Recipe
Result
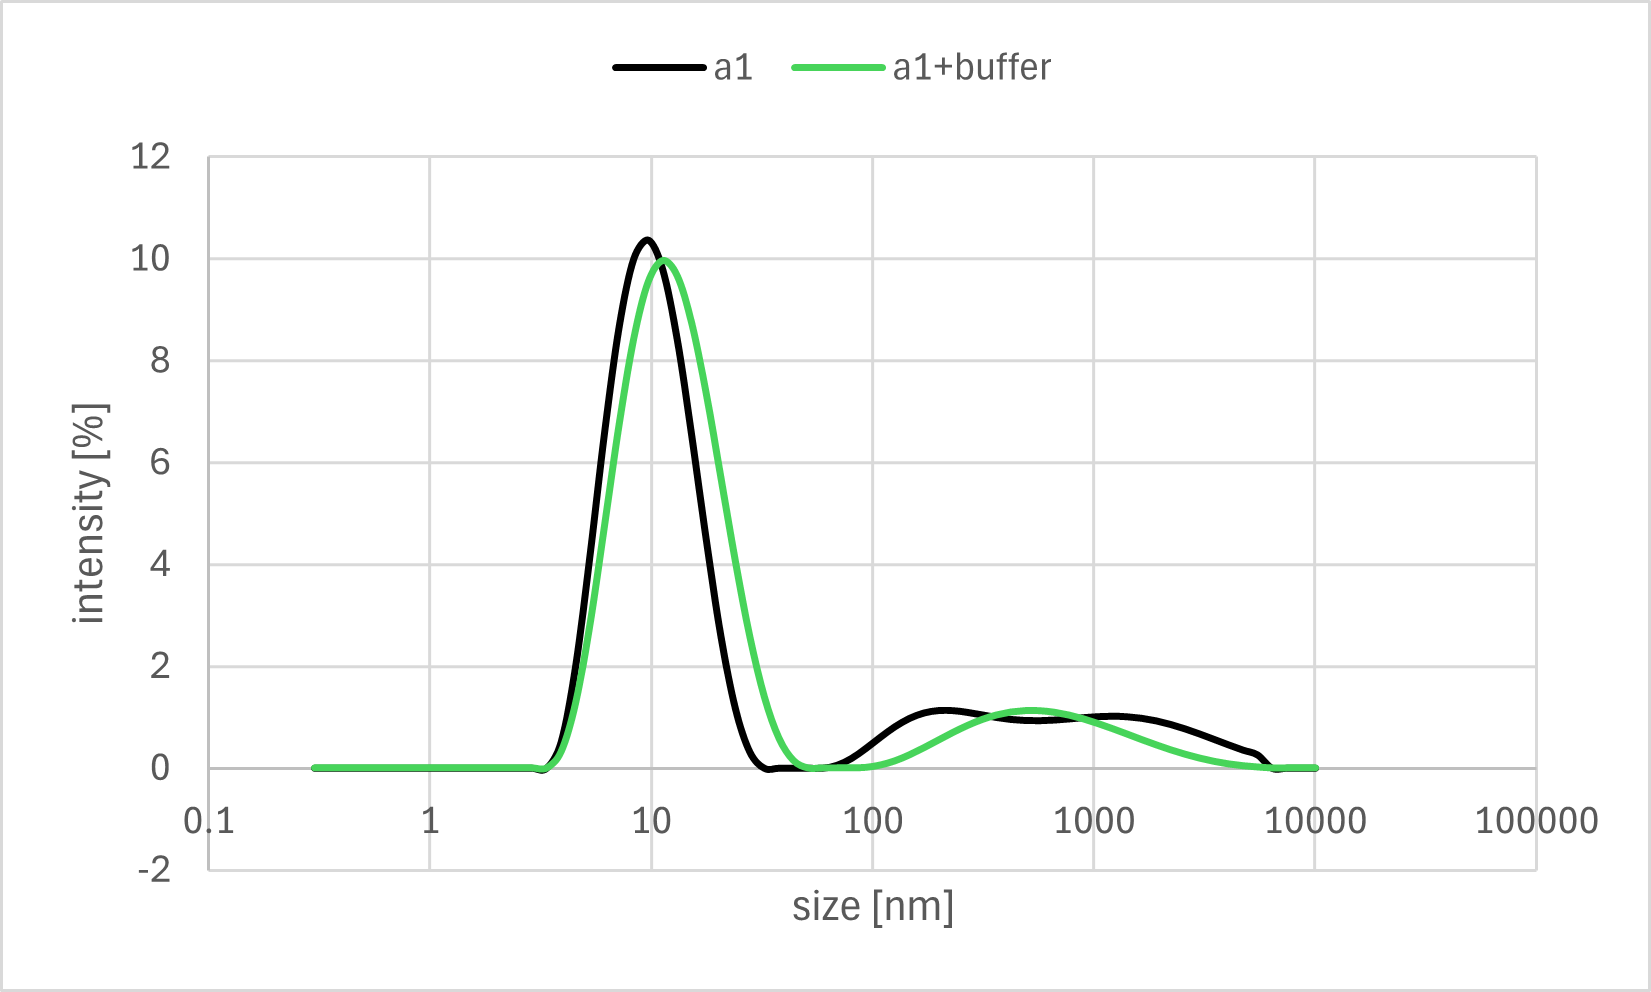
Figure 7a. Sample A1 DLS Result
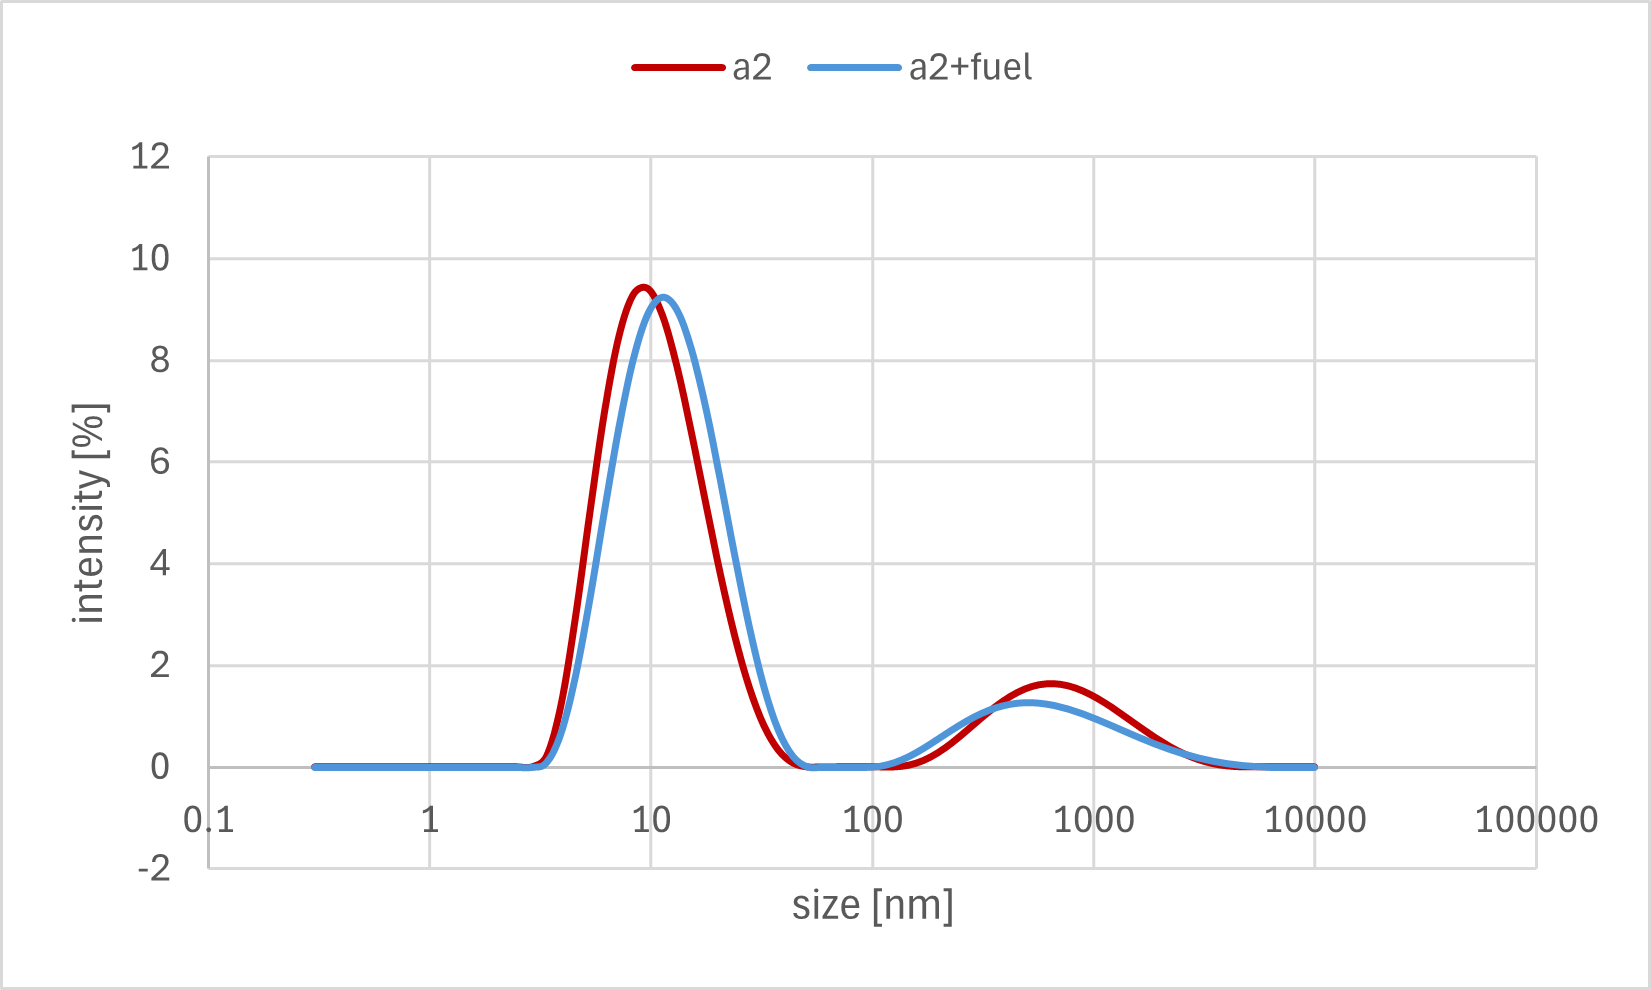
Figure 7b. Sample A2 DLS Result
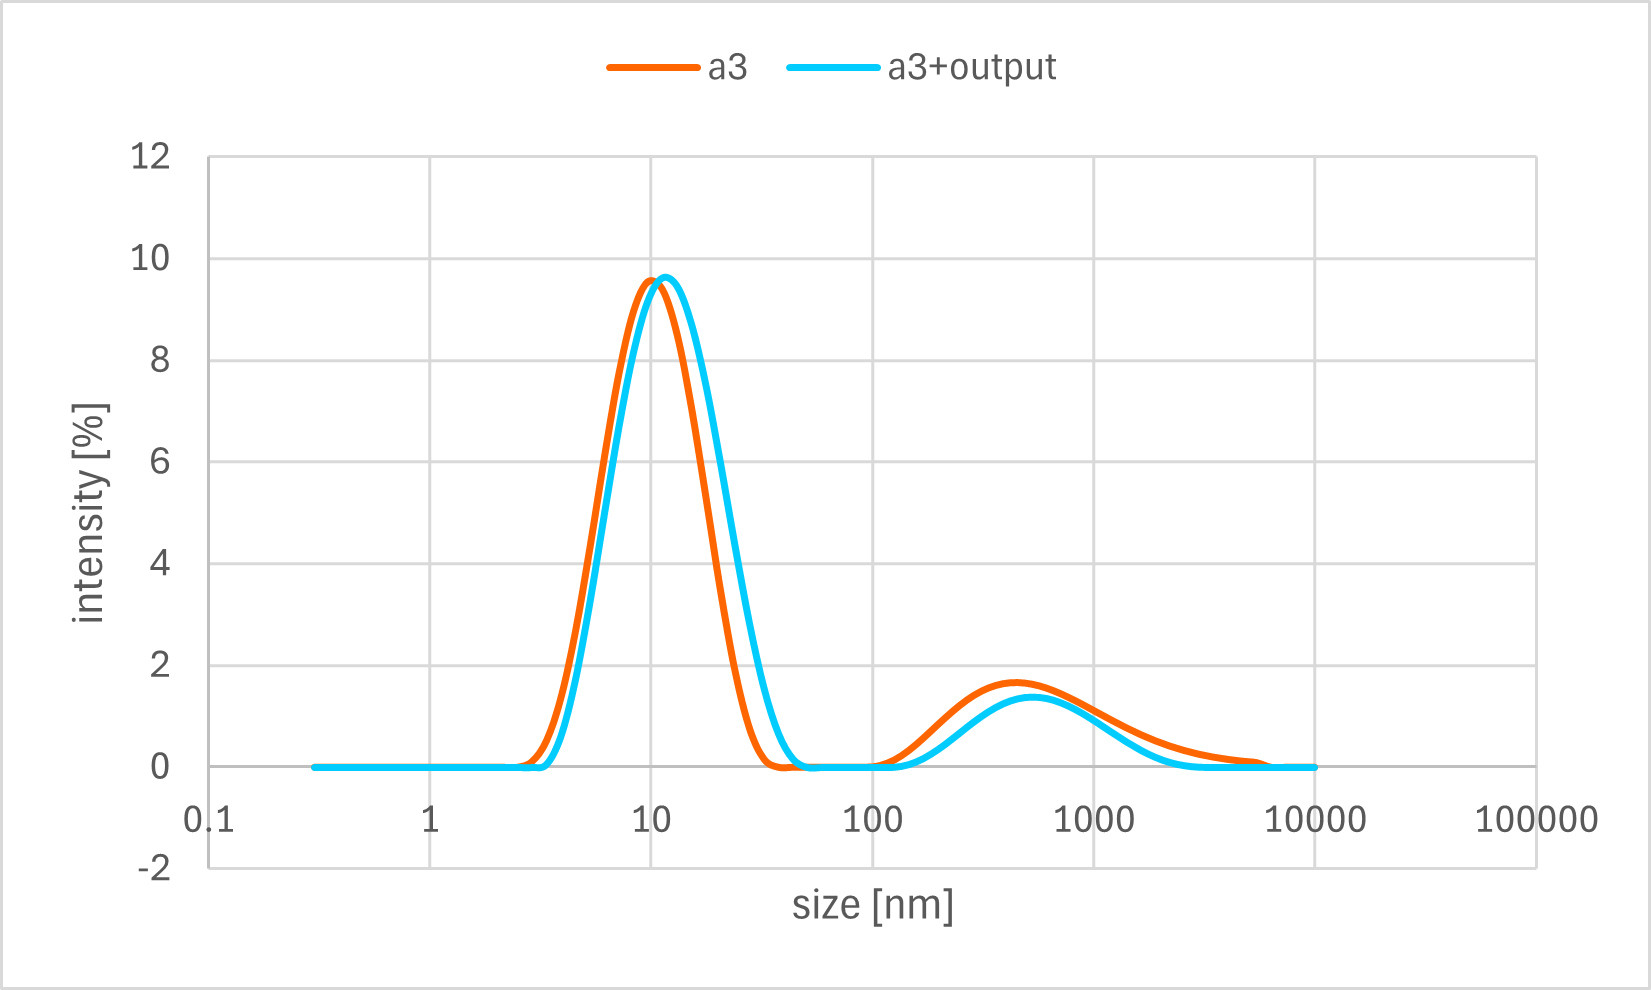
Figure 7c. Sample A3 DLS Result
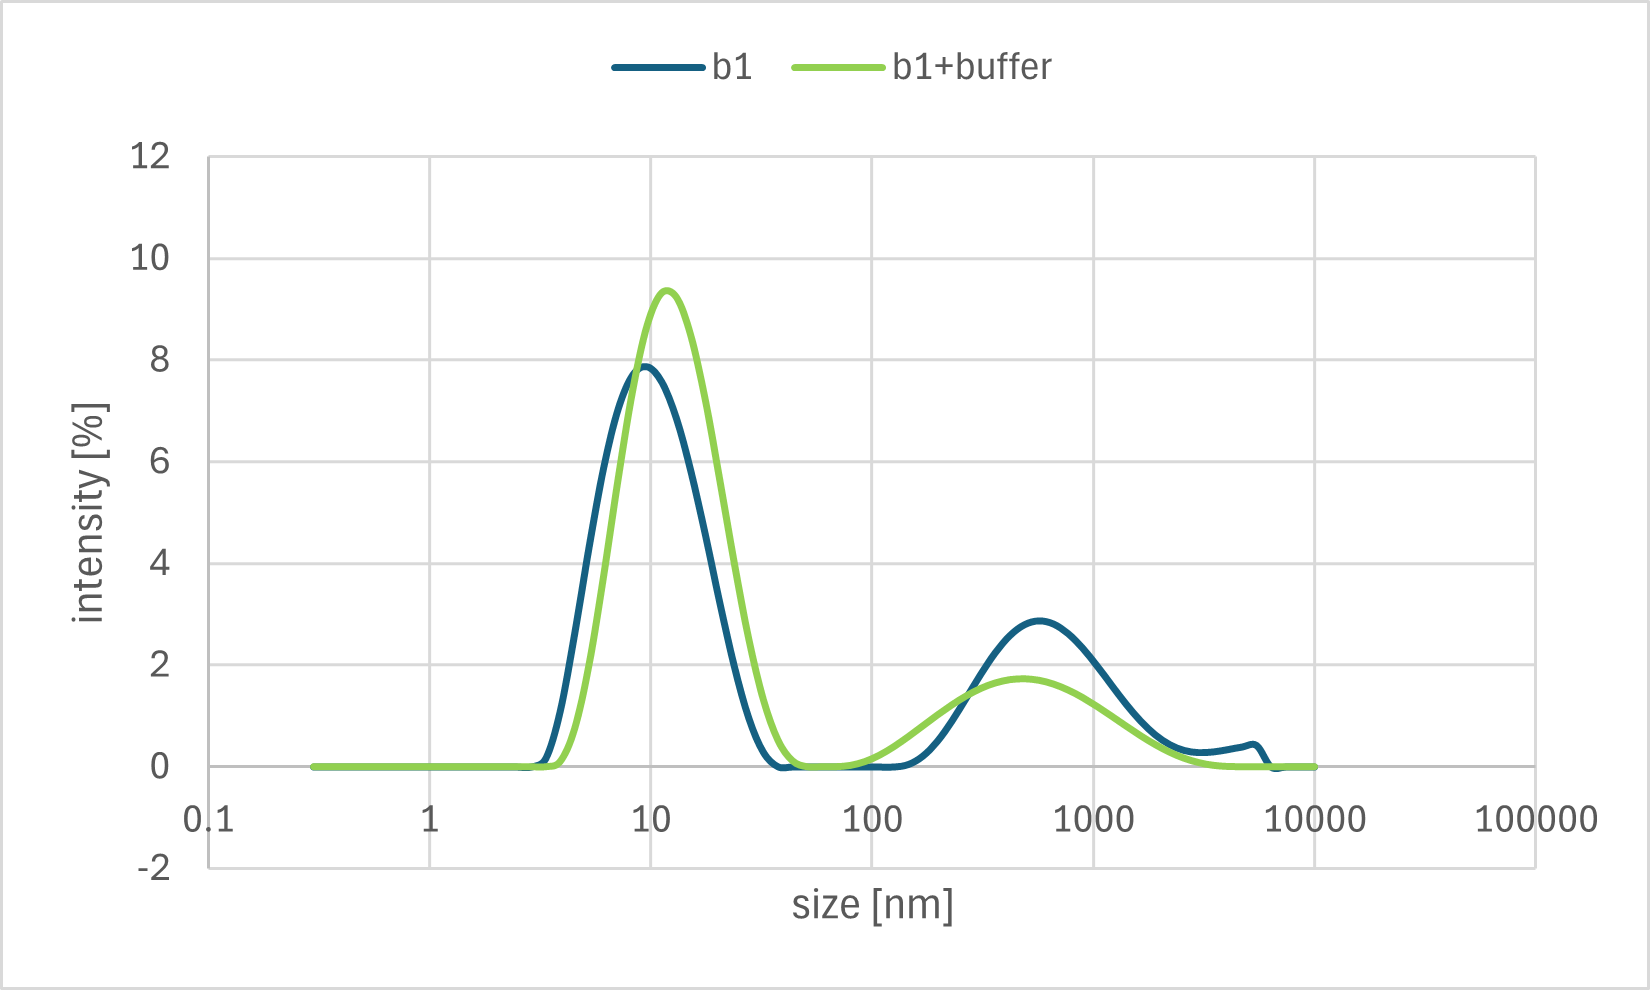
Figure 7d. Sample B1 DLS Result
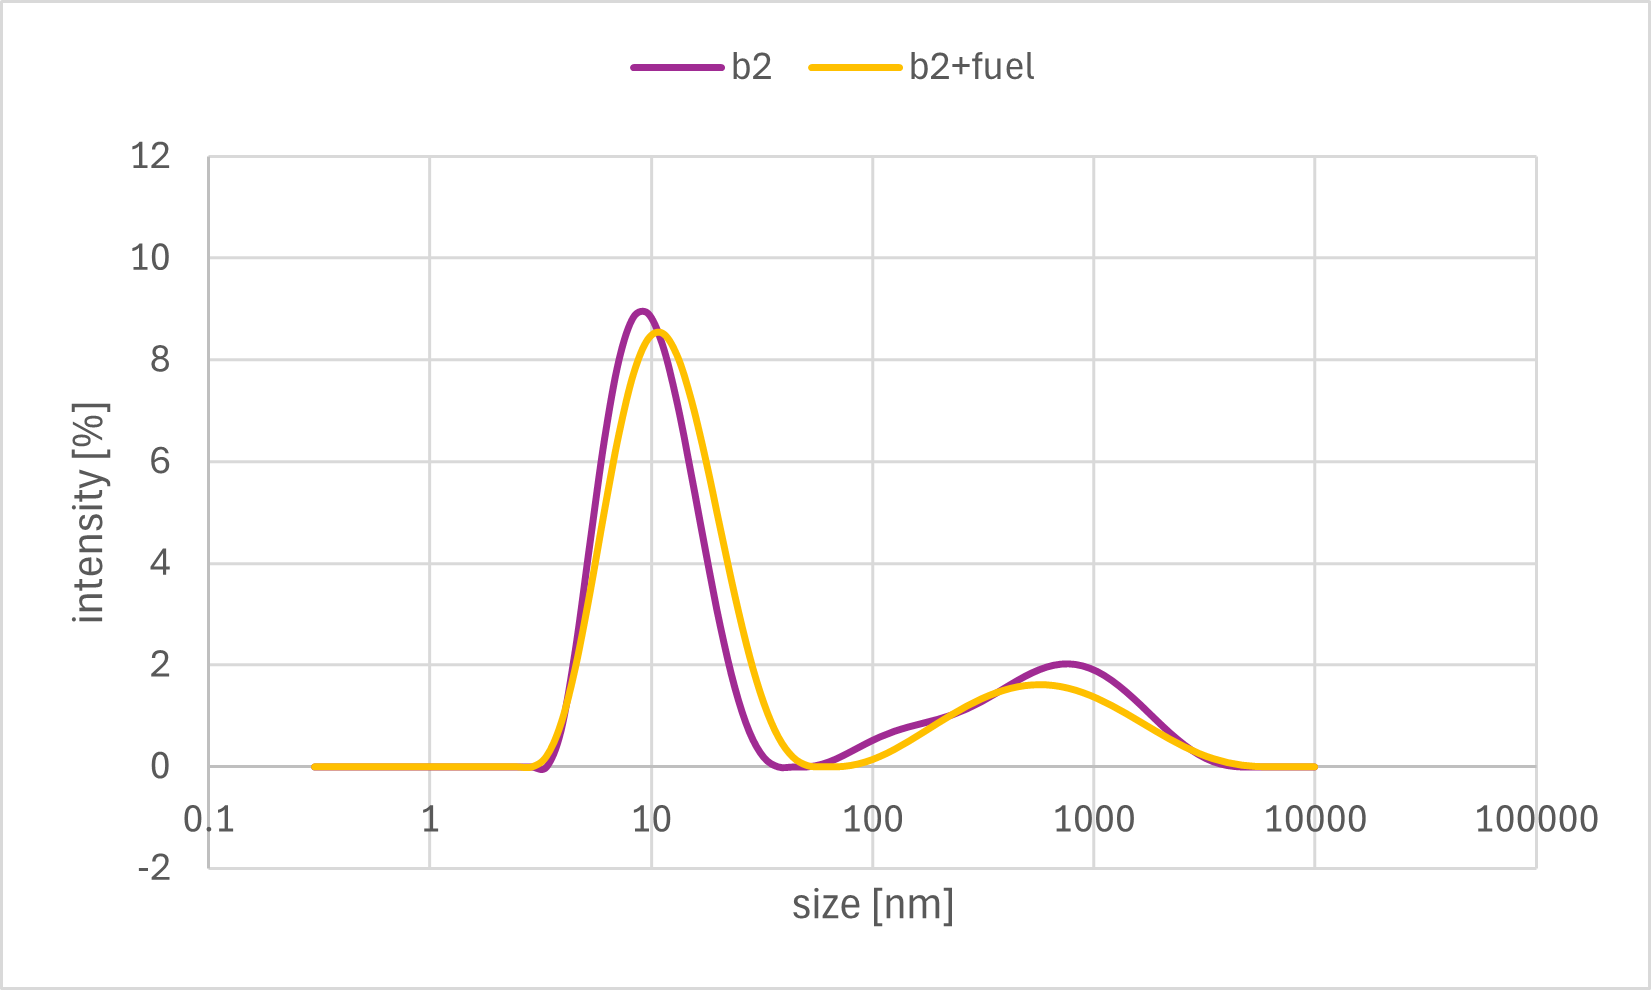
Figure 7e. Sample B2 DLS Result
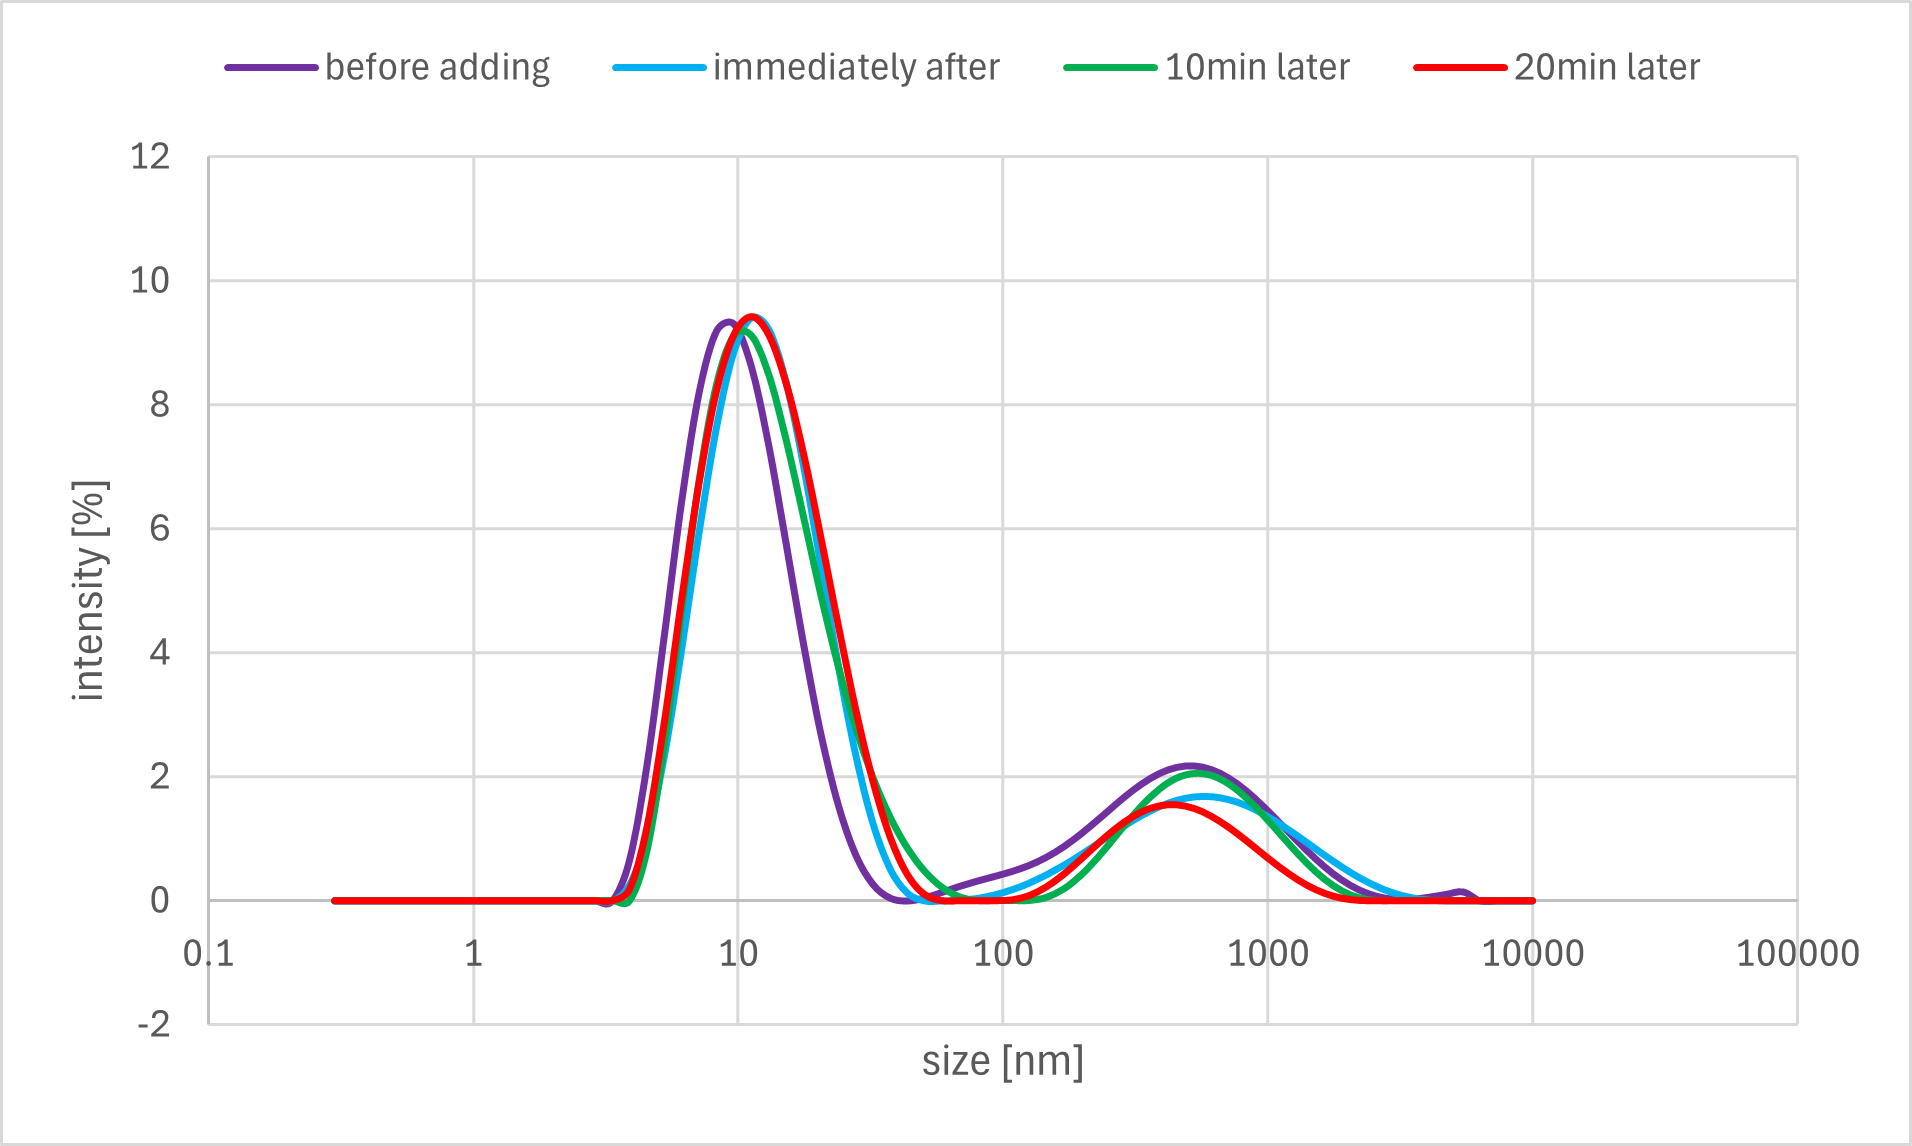
Figure 7f. Sample B3 DLS Result
A horizontal comparison of the resulting graphs revealed no significant differences among the samples to which the Output strand, Fuel strand, or buffer alone was added.
Furthermore, a vertical comparison of the graphs showed no significant variations attributable to the timing of the annealing process. In the time-course analysis of Sample #B3, no remarkable changes in the particle size distribution were observed from immediately after the addition of the Output strand up to 20 minutes later.
These results indicate that no significant decrease in particle size, as measured by DLS, was observed even after the addition of the Output strand, which was expected to disrupt the bonds between the gel motifs. One possible explanation is that the binding between the sticky ends was more stable than anticipated, thus preventing the strand displacement reaction from proceeding sufficiently. Alternatively, even if partial dissociation did occur, the change in overall particle size may have been too small to be detected by DLS, as the sticky end portions constitute a minor fraction of the entire hydrogel motif.
Next Step
To more directly confirm whether the Output strand can cleave the bonds between the sticky ends, samples will be prepared using two of the four motif types. The progress of the reaction after the addition of the Output strand will then be evaluated by gel electrophoresis. (Experiment 10)
Experiment 8 : Evaluation of Aggregate Size using AGE (Agarose Gel Electrophoresis)
Objective
The primary objective is to evaluate the relative size of the DNA assemblies, which previously exceeded the separation limit of PAGE, by using agarose gel electrophoresis, a method suitable for a broader molecular weight range. A secondary objective is to determine if the addition of the Output strand from the entropy-driven circuit induces the dissociation of the bonds between the sticky ends, resulting in a measurable decrease in assembly size.
Method
In this experiment, we prepared a total of 13 samples, which were divided into two series: Sample #A and Sample #B. The Sample #A series consisted of four samples with a varying number of DNA motif sequence types. For each sample, the specified DNA motifs were prepared at a concentration of 250 nM each in a buffer solution (12.5 mM MgCl₂, 10 mM Tris, 1.0 mM EDTA). The total volume of each sample was 2.5 µL. The compositions were as follows:
- #A1: 1 motif type (Strand 3)
- #A2: 2 motif types (Strand 2, 3)
- #A3: 3 motif types (Strand 1, 2, 3)
- #A4: 4 motif types (Strand 1, 2, 3, 4)
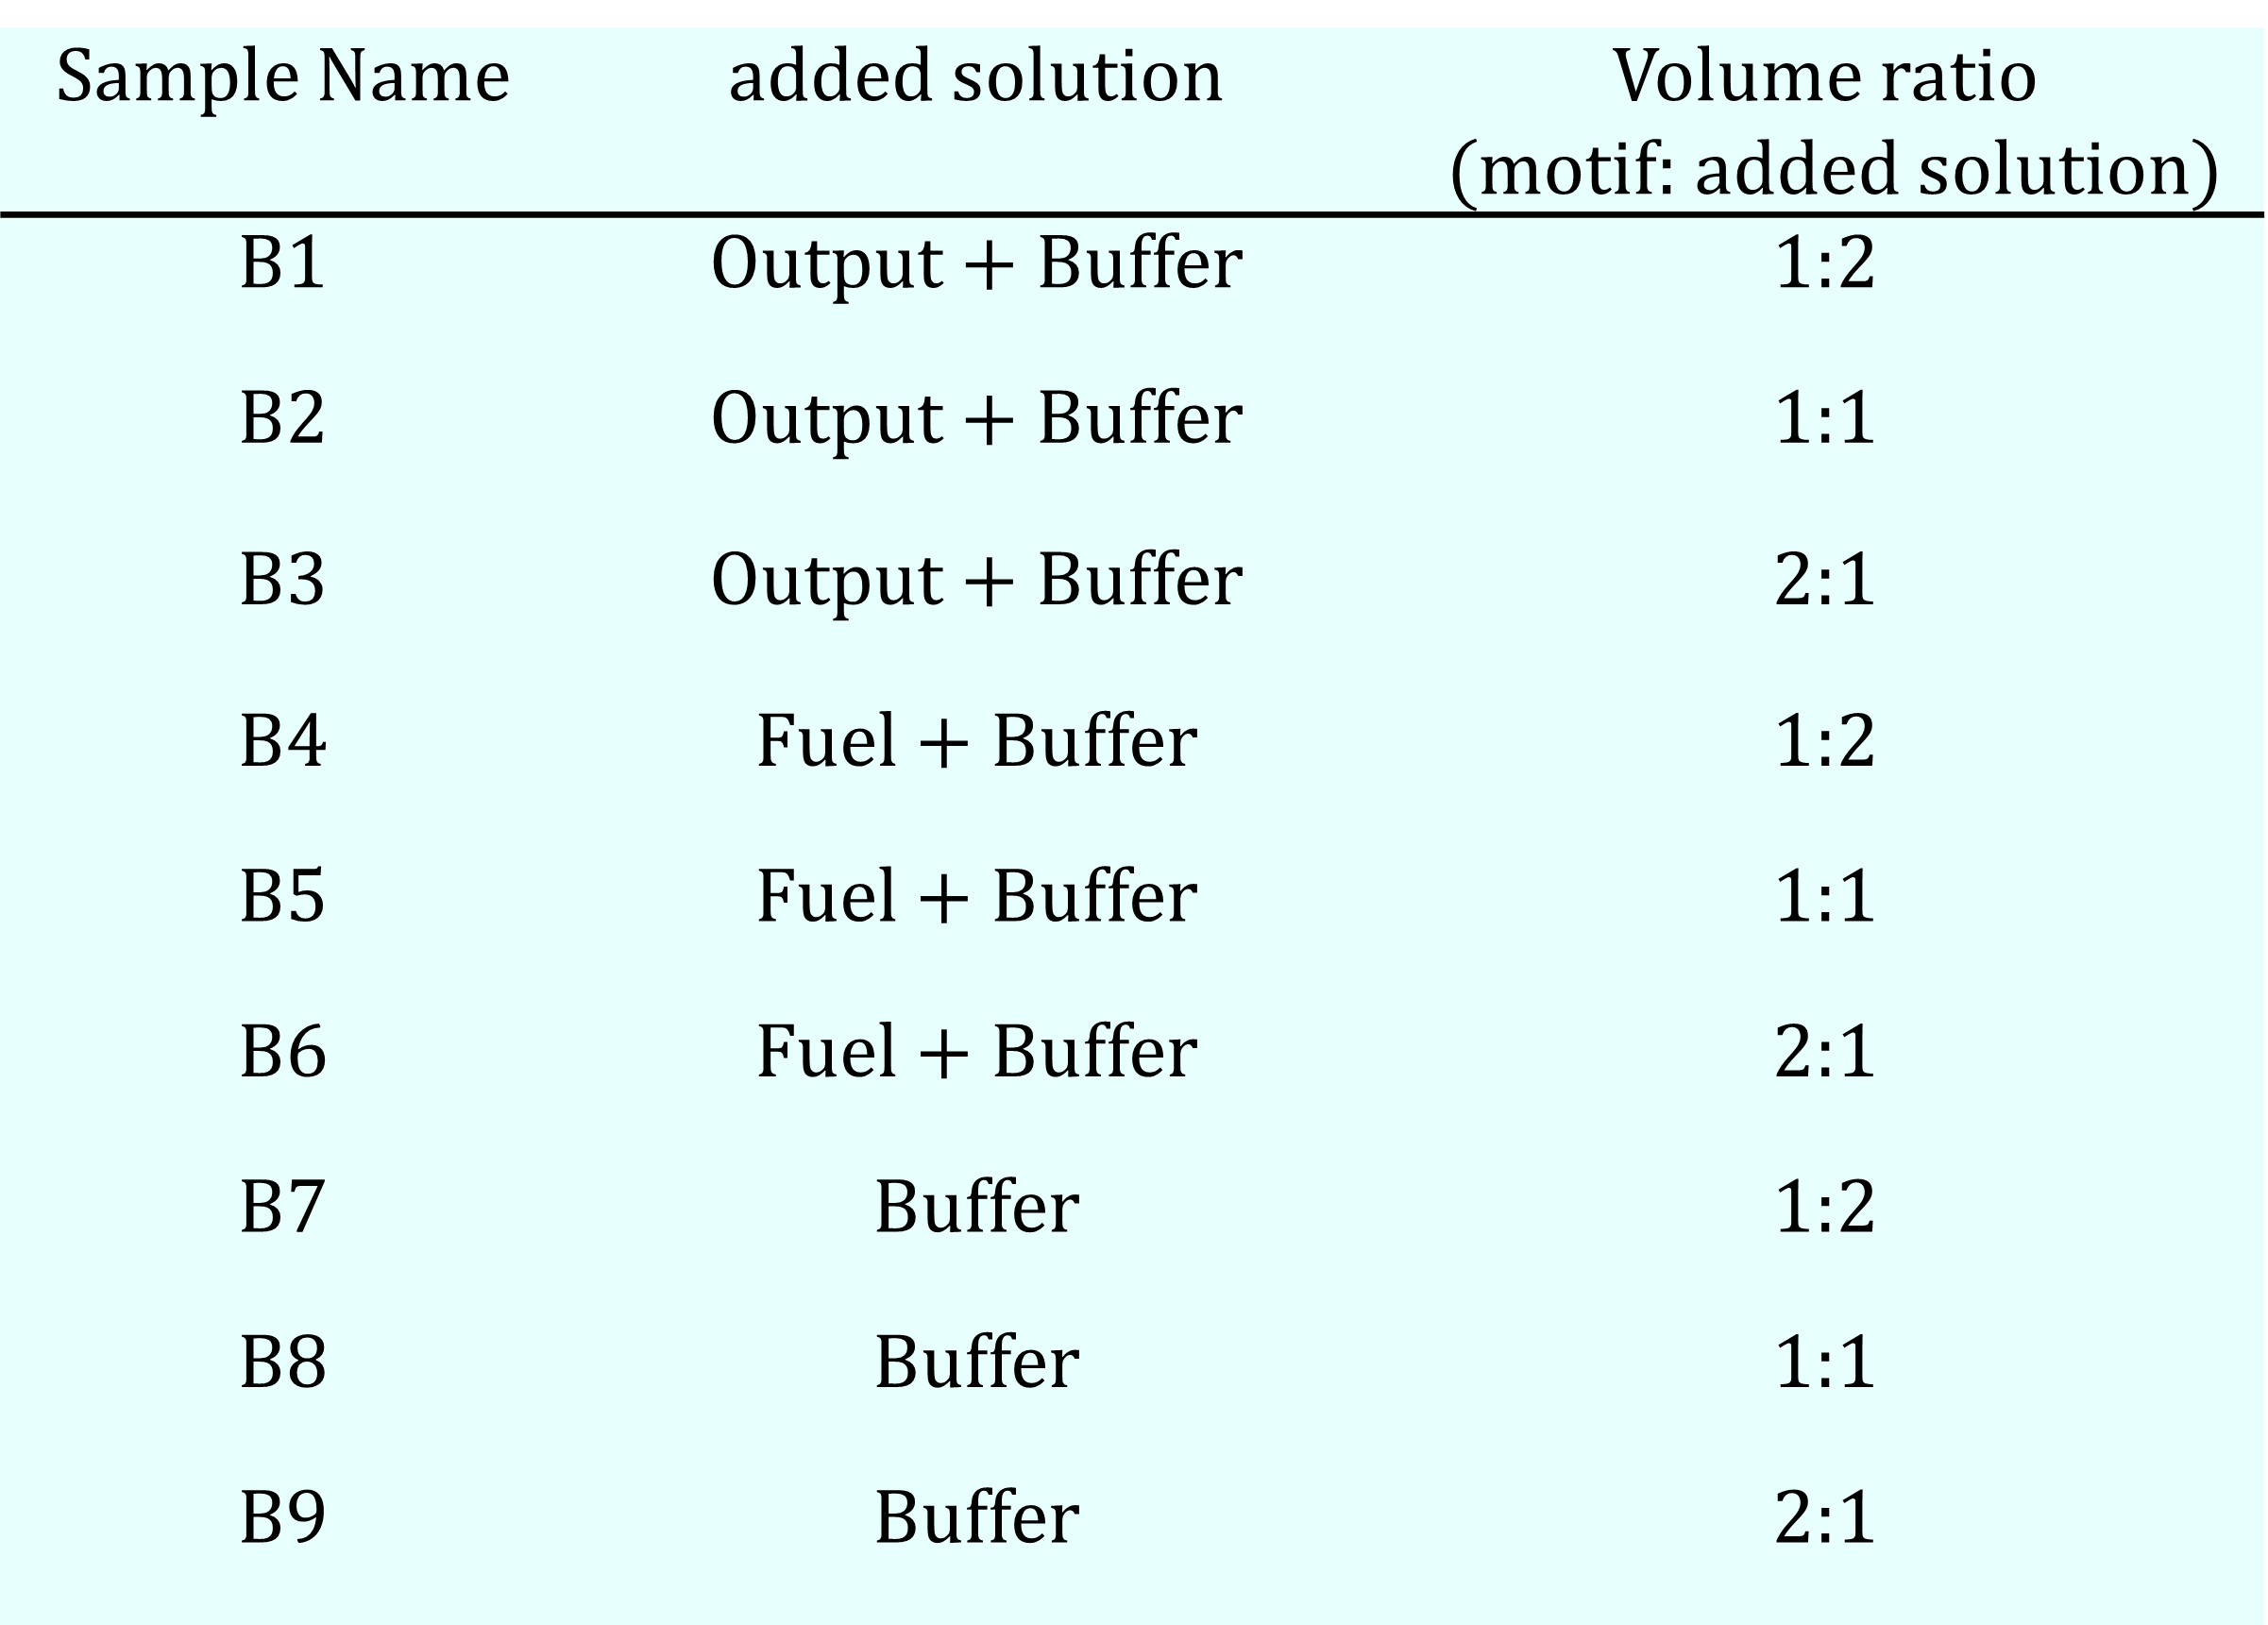
The Sample #B series comprised nine samples, which were prepared by adding a solution containing either an Output strand (500 nM), a Fuel strand (500 nM), or buffer alone to a base solution containing all four motif sequences (500 nM each). The motif solution and the added solution were mixed at different volume ratios (2:1, 1:1, and 1:2) to a final volume of 2.5 µL for each sample (details in Table 8a). The buffer concentration was maintained constant across all samples.
All prepared samples were subjected to an annealing process: heating to 95°C for 5 minutes, followed by cooling to 4°C at a rate of -1°C per minute. Samples to which the Output or Fuel strands were added were subsequently incubated at room temperature for 30 minutes. Following this, 0.5 µL of loading buffer was added to each sample, bringing the final volume to 3.0 µL.
The samples were then loaded onto a 3% agarose gel. Electrophoresis was performed at a constant voltage of 100 V for 30 minutes. To maintain the structural integrity of the DNA assemblies, the electrophoresis was conducted inside a 4°C refrigerator. A 20 bp DNA Ladder was used as a size reference. After the electrophoretic run, the gel was observed with a fluorescence imager to analyze the band patterns.
Table 8a. Sample#B Condition
Result
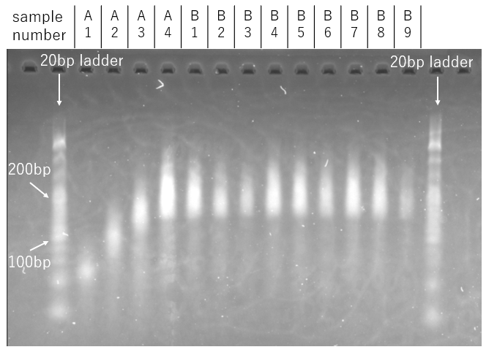
Figure 8a. Agarose Gel Electrophoresis Result
When comparing samples prepared with the same component ratios, the bands corresponding to the samples with the Output strand were observed to be fainter. Furthermore, a comparison among the Output strand samples themselves revealed that the bands became progressively fainter as the concentration of the Output strand increased. These results suggest that the addition of the Output strand may inhibit the formation of DNA assemblies.
However, a limitation of this experimental design is that varying the volume ratios resulted in simultaneous changes to the concentrations of both the motif sequences and the Output strand. Consequently, it was not possible to definitively distinguish whether the observed decrease in band intensity was due to a lower overall DNA concentration or to the dissociation of the assemblies induced by the Output strand.
Next Step
An experiment will be conducted in which only the concentrations of the Output and Fuel strands are varied, while the concentration of the motif sequences is kept constant across all samples. (Experiment 9)
Experiment 9 : Output-Induced Sticky-Ends Displacement Analysis by AGE (Agarose Gel Electrophoresis)
Objective
To determine if the decrease in band intensity observed in the previous experiment is attributable to the dissociation of sticky-end bonds caused by the Output strand. This will be investigated by varying only the concentrations of the Output and “Fuel" strands while maintaining a constant concentration of the motif sequences across all samples.
Method
In this experiment, a total of 11 samples were prepared at a volume of 2.5 µL each, following a procedure similar to that of Experiment 4. The samples were organized into two series: Sample #A, which consisted of four samples with a varying number of DNA motif types, and Sample #B, which comprised seven samples created by adding an Output strand, a Fuel strand, or buffer to a solution containing all four motif types.
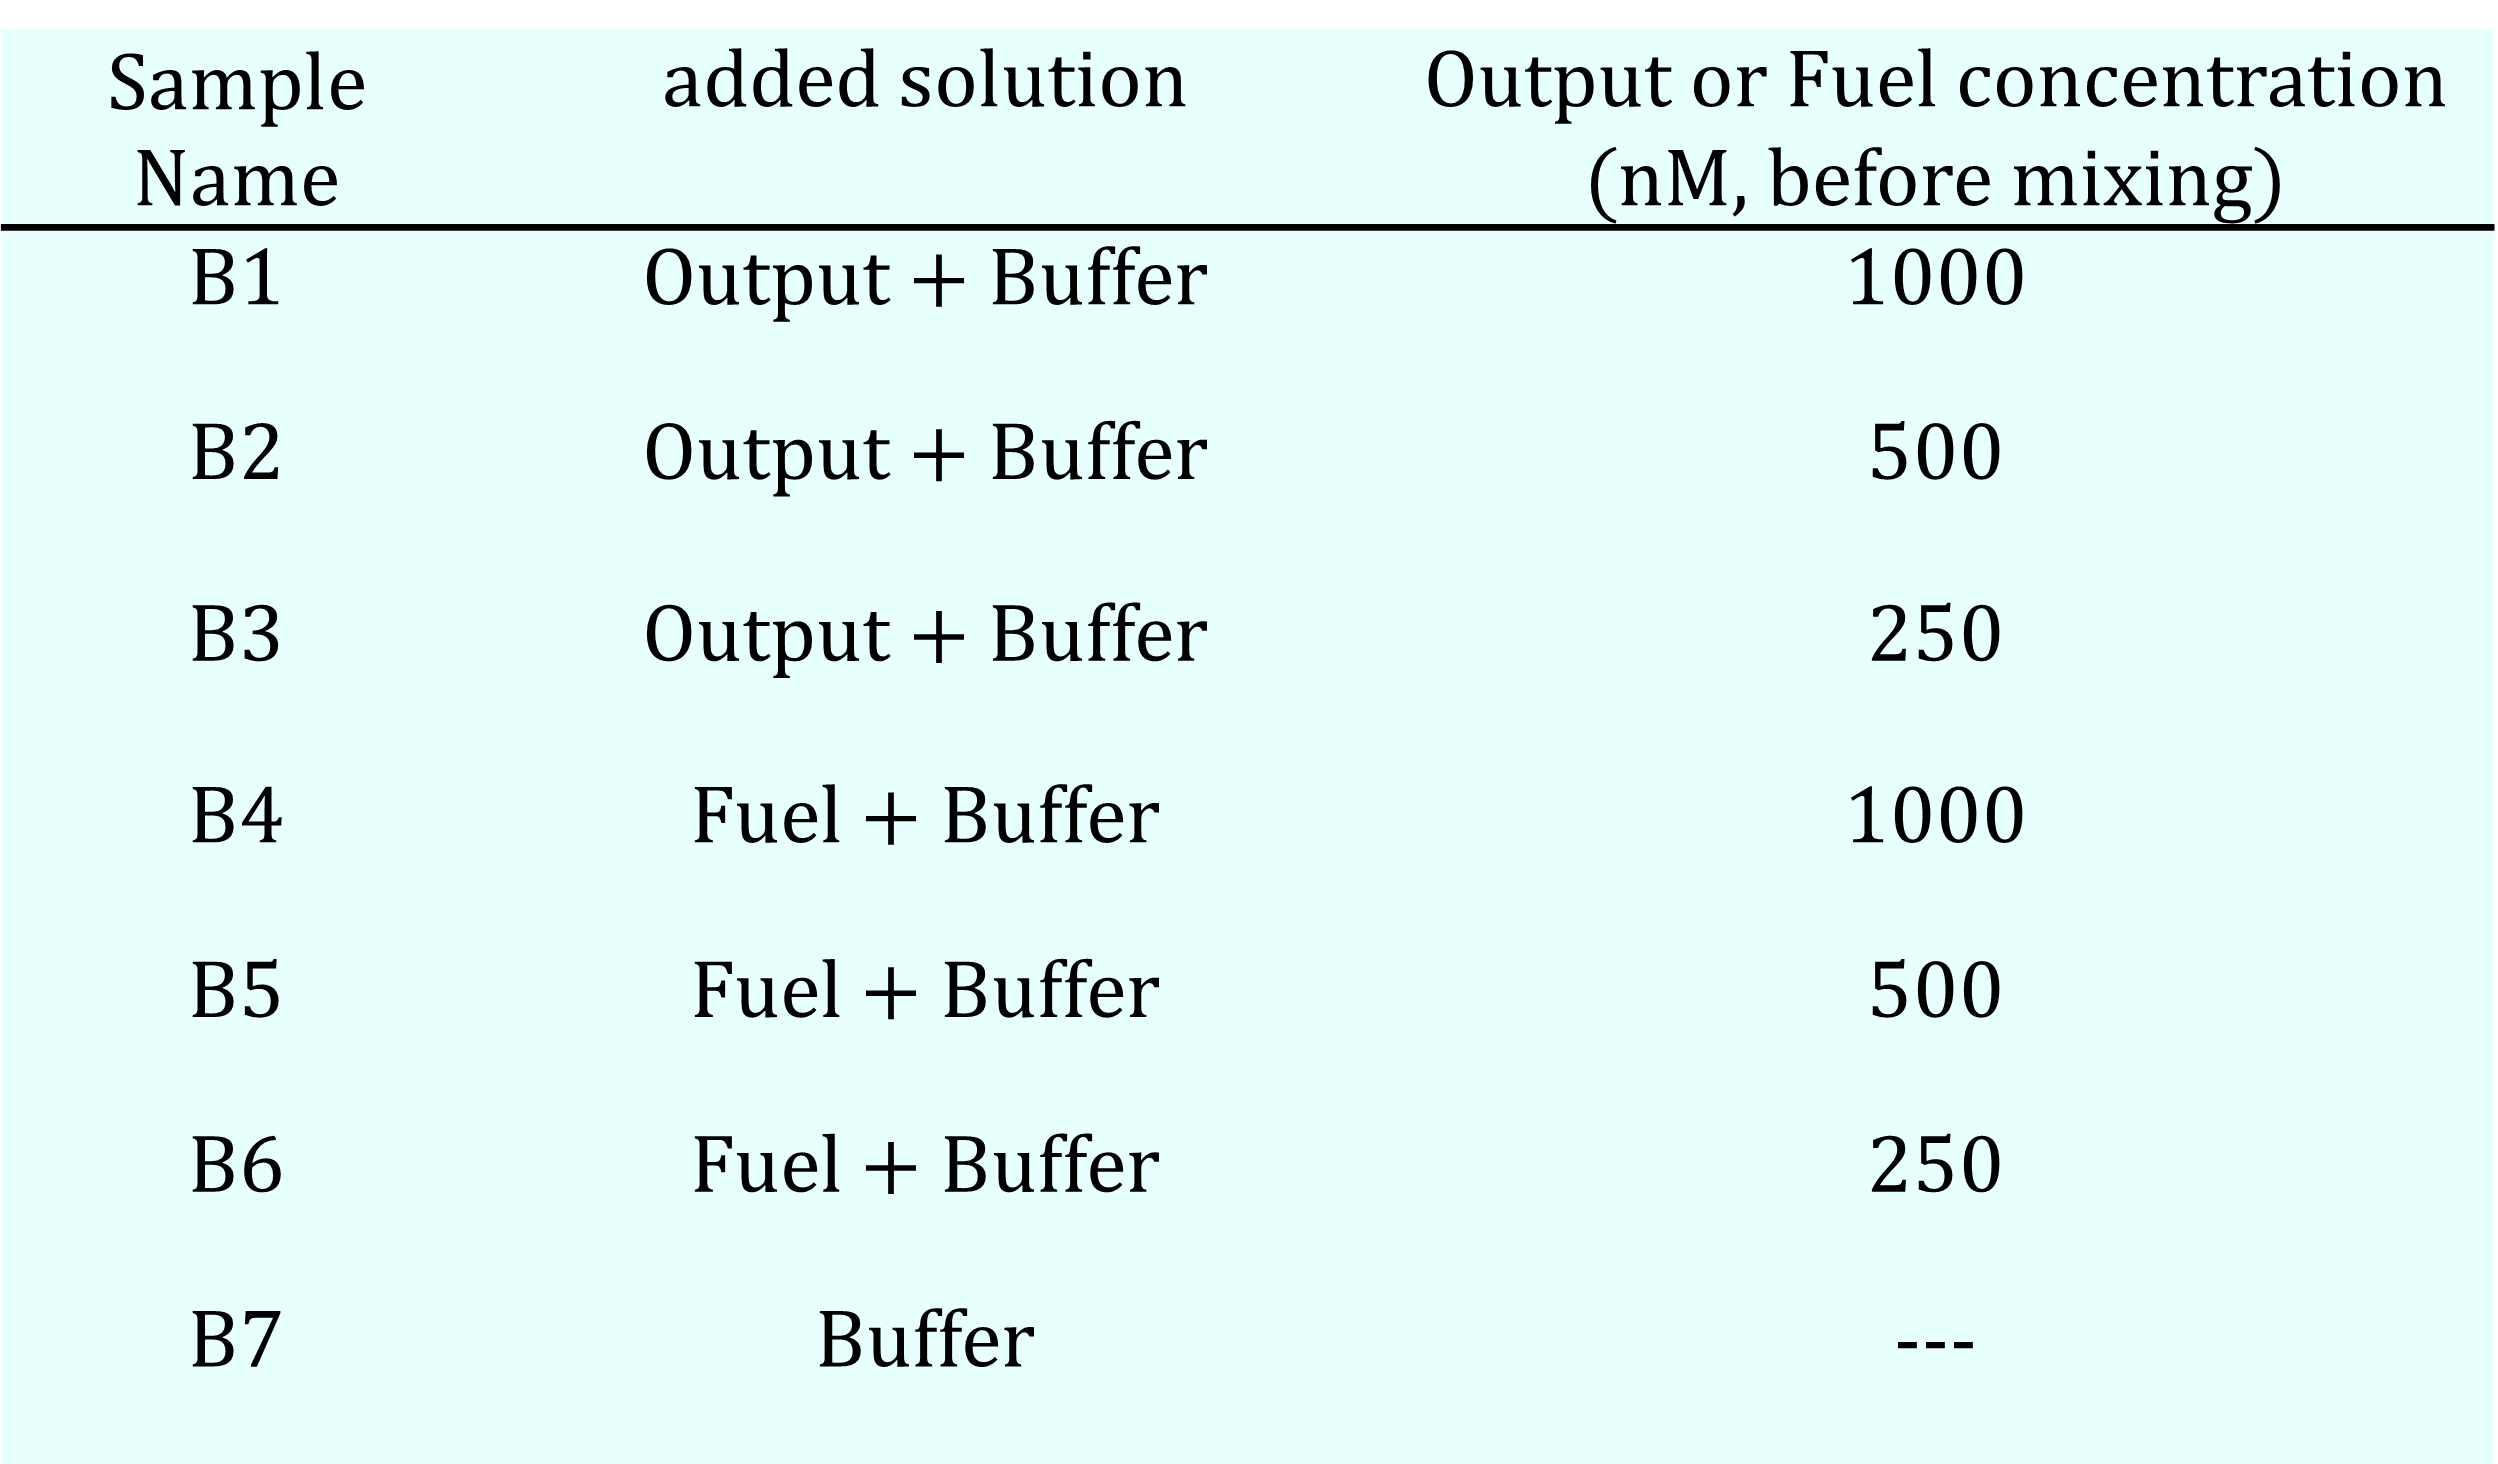
The Sample #A series was prepared by mixing the specified DNA motif sequences at 250 nM each in a buffer solution (12.5 mM MgCl₂, 10 mM Tris, 1.0 mM EDTA), as detailed in Experiment 4. For the Sample #B series, a total of seven samples were prepared under three conditions, as shown in Table 9a, by adding either the Output strand, the Fuel strand, or buffer alone to a base solution containing all four motif sequences (500 nM each).
All prepared samples were subjected to an annealing process by heating to 95°C for 5 minutes, followed by cooling to 4°C at a rate of -1°C per minute. Samples containing the Output or Fuel strands were subsequently incubated at room temperature for 30 minutes. Prior to electrophoresis, 0.5 µL of loading buffer was added to each sample, bringing the final volume to 3.0 µL.
The samples were then loaded onto a 3% agarose gel and subjected to electrophoresis at a constant voltage of 100 V for 30 minutes. To preserve the integrity of the DNA assemblies, the electrophoresis was conducted inside a 4°C refrigerator. A 20 bp DNA Ladder was used as a size reference. After the run, the gel was visualized using a fluorescence imager to analyze the resulting band patterns.
Table 9a. Sample#B Condition
Result
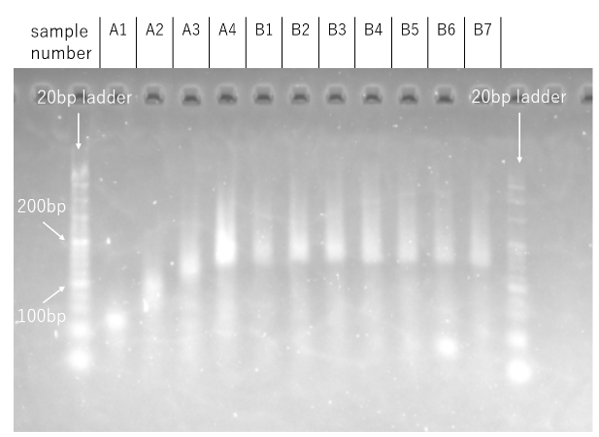
Figure 9a. Agarose Gel Electrophoresis 2nd time Result
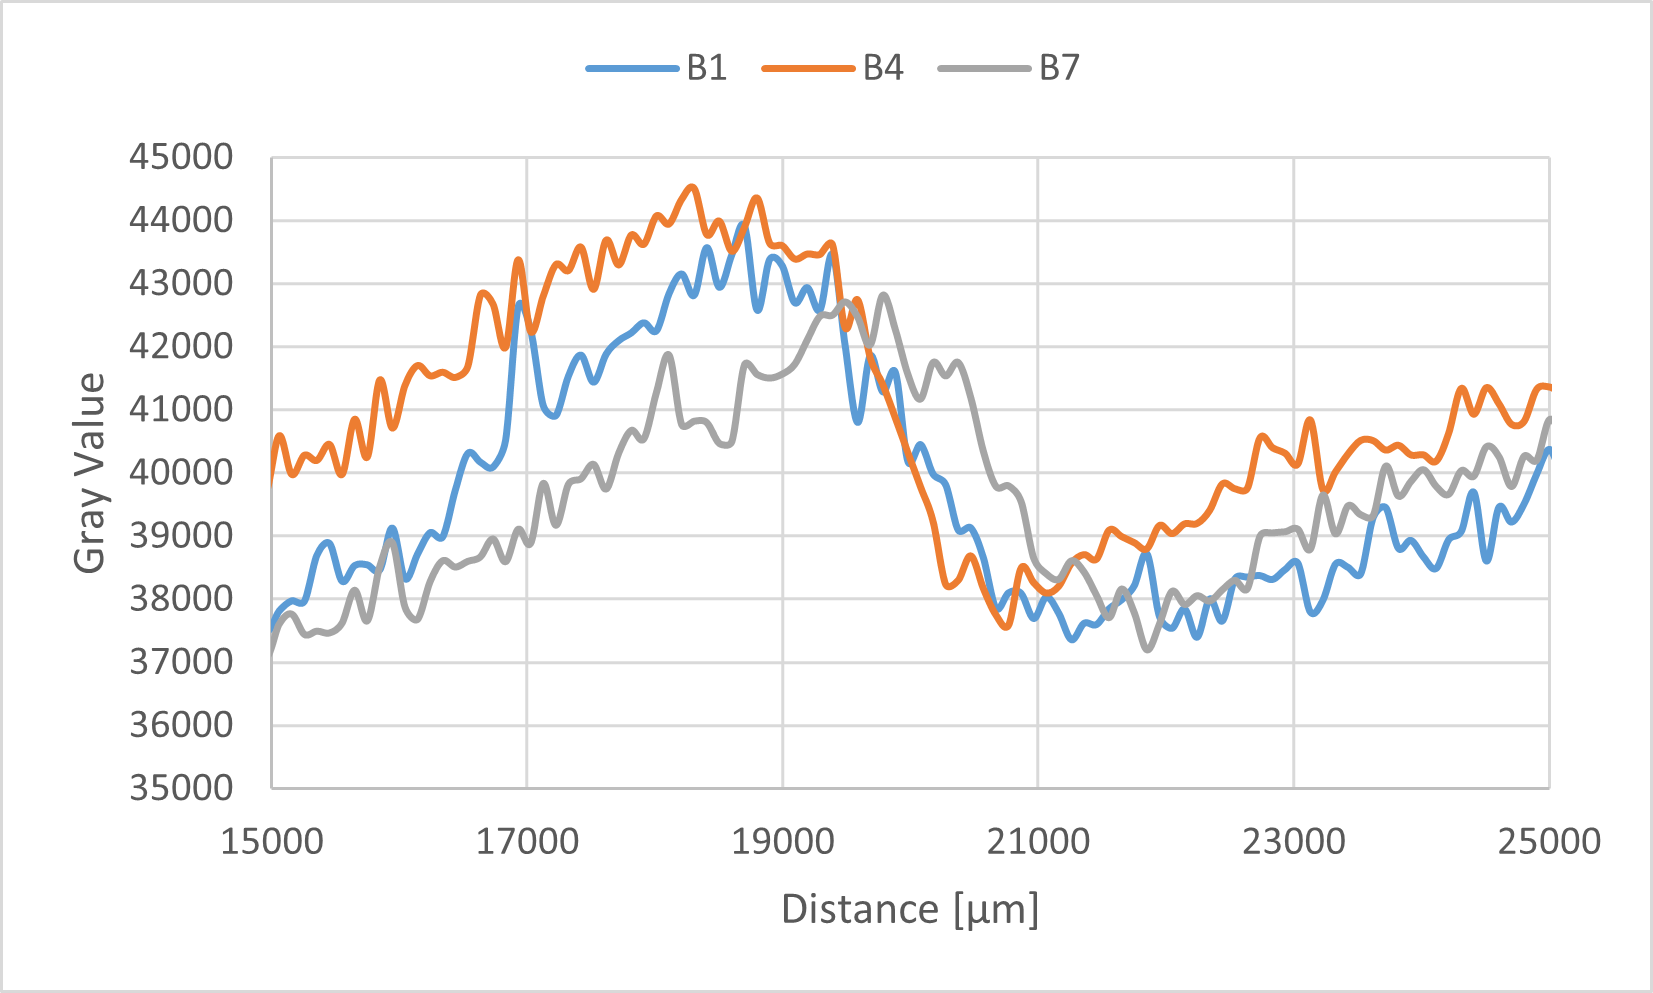
Figure 9b. Intensity comparison
Upon visual inspection of Fig. 9a, the band for sample B1, to which the Output strand was added at a concentration of 1000 nM, appeared fainter than the other samples. However, to account for the possibility of an optical illusion, three representative samples (B1, B4, and B7) were selected for a quantitative comparison of their band intensities (Fig. 9b). The quantitative analysis revealed no significant difference in intensity among these three samples, failing to substantiate the initial visual impression from Fig. 9a. Therefore, under the current experimental conditions, the inhibitory effect of the Output strand on assembly formation remains inconclusive. It is highly probable that the observed results were influenced by measurement errors and/or variations in sample preparation.
Next Step
The results from the agarose gel electrophoresis (Experiments 8 and 9) and the polyacrylamide gel electrophoresis (Experiment 10 and subsequent experiments) will be comprehensively analyzed to evaluate the overall effect of the Output strand-induced dissociation of sticky-end bonds on the formation of DNA assemblies.
Experiment 10 :Output-Induced Displacement Analysis by PAGE(1st)
Objective
The objective is to directly determine, by means of gel electrophoresis, whether the Output strand can cleave the bonds between the sticky ends.
Method
In this experiment, eight different samples were prepared at a volume of 5.0 µL each, as depicted in the results (Fig. 10a). For each sample, strand 2, strand 3, the Output strand, and the Fuel strand were added as required and mixed in a buffer containing 12.5 mM MgCl₂, 10 mM Tris, and 1.0 mM EDTA. The final concentrations were adjusted to 0.25 µM for strand 2, strand 3, and the Output strand, and 0.5 µM for the Fuel strand. Following preparation, 1.0 µL of loading buffer was added to and mixed with each sample. A 10% polyacrylamide gel (polymerized with 0.1% TEMED and 0.1% APS) was prepared, and the samples were loaded onto the gel. Electrophoresis was then conducted at a constant voltage of 100 V for 50 minutes. After the run, the gel was stained with SYBR Gold, and the mobility of the resulting bands was observed under UV illumination.
Result
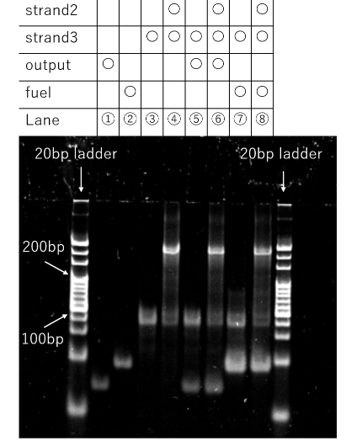
Figure 10a. PAGE Result
In lane 4, which contained only strand 2 and strand 3, a band was observed at a high-molecular-weight position. A comparison between lane 4 and lane 6, both of which contained two DNA motifs, revealed no significant differences in the band patterns. These results suggest that a complex is formed between the two motifs via their sticky ends. However, it is also indicated that even with the addition of the Output strand, the bonds between the sticky ends were not cleaved and remained intact. Furthermore, in this experimental protocol, the DNA solution was incubated at 4°C for approximately 30 minutes after mixing. The Output strand was then added, and the solution was incubated for an additional 30 minutes under refrigeration. It is possible that under these conditions, the rapid cooling strongly stabilized the sticky-end bonds between the DNA motifs, thereby inhibiting the progression of the intended displacement reaction.
Next Step
In the next experiment, the reactions following the initial mixing and after the addition of the Output strand will be conducted at room temperature to determine if the temperature affects the outcome.(Experiment 11)
Experiment 11 : Output-Induced Displacement Analysis by PAGE(2nd)
Objective
To re-evaluate whether the Output strand can cleave the bonds between the sticky ends by modifying the previous experimental conditions, specifically by conducting the incubation steps (after initial DNA mixing and after Output strand addition) at room temperature.
Method
In this experiment, a total of 14 different samples were prepared at a volume of 5.0 µL each, as depicted in the results (Fig. 11a). For each sample, strand 1, strand 2, strand 3, strand 4, the Output strand, and the Fuel strand were added as required and mixed in a buffer containing 12.5 mM MgCl₂, 10 mM Tris, and 1.0 mM EDTA. The final concentration for each of the motif DNA strands, as well as for the Output and Fuel strands, was 0.25 µM. The detailed preparation procedure was as follows:
- The required motif DNA strands (strands 1-4) were mixed in the buffer and incubated at room temperature for 30 minutes.
- Next, the corresponding Output or Fuel strand was added, and the solution was incubated for an additional 30 minutes at room temperature.
- 1.0 μL of loading buffer was added to each sample and mixed.
A 10% polyacrylamide gel (polymerized with 0.1% TEMED and 0.1% APS) was prepared, and the samples were loaded onto the gel. Electrophoresis was conducted at a constant voltage of 100 V for 50 minutes. Following the run, the gel was stained with SYBR Gold, and the mobility of the bands was observed under UV illumination.
Result
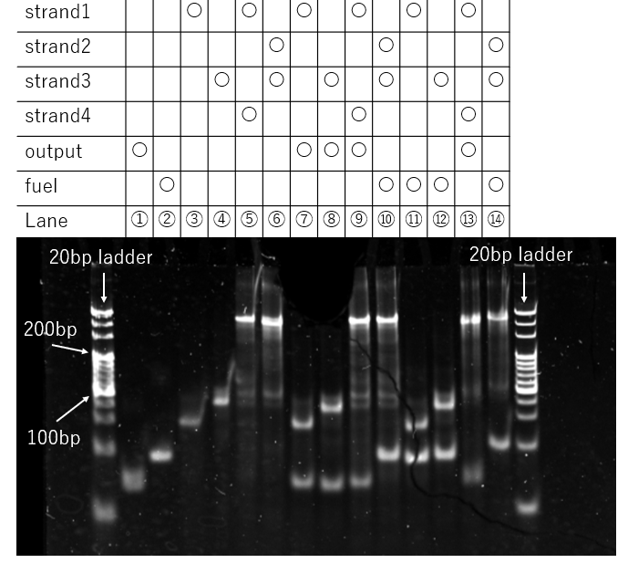
Figure 11a. PAGE Result
In lane 5 (strand 1 + strand 4) and lane 6 (strand 2 + strand 3), distinct and intense bands were clearly observed in the high-molecular-weight region near the top of the gel. Furthermore, a comparison of the bands in lane 5 versus lane 9, and lane 6 versus lane 10, revealed no significant differences.
These results suggest that even under the modified experimental conditions, the bonds between the sticky ends remain intact and are not cleaved by the addition of the Output strand. Additionally, these findings make it unlikely that the DNA sequences were designed or synthesized incorrectly.
Next Step
In the next experiment, an annealing process will be performed on a mixture of two selected motif DNA types and the Output strand. The objective is to determine which of the following processes is thermodynamically favored: the binding between the sticky ends or the formation of a complementary duplex between a motif and the Output strand. This will serve to verify the correctness of the sticky end sequence design and to confirm that the synthesized DNA strands are free of errors. The possibility of an issue with the Output strand sequence itself can be excluded, as it was previously shown in Experiment 2 to react correctly with its reporter strand to produce a fluorescent signal. Therefore, this next phase of verification will focus specifically on the validity of the sticky end sequence design. (Experiment 12)
Experiment 12 :Output-Induced Displacement Analysis by PAGE(3rd)
Objective
To verify the correctness of the Output strand's sequence design and confirm that the synthesized strand is free of errors. This will be achieved by modifying the previous experimental conditions to perform annealing immediately after mixing the DNA solution and adding the Output strand.
Method
In this experiment, a total of 14 different samples were prepared at a volume of 5.0 µL each, as depicted in the results (Fig. 12a). For each sample, strand 1, strand 2, strand 3, strand 4, the Output strand, and the Fuel strand were added as required and mixed in a buffer containing 12.5 mM MgCl₂, 10 mM Tris, and 1.0 mM EDTA. The final concentration was adjusted to 0.25 µM for each of the motif DNA strands and the Output strand, and to 0.5 µM for the Fuel strand.
The preparation procedure was as follows: The required motif DNA strands (strands 1-4) were mixed in the buffer, and subsequently, the corresponding Output or Fuel strand was added. The entire mixture was then subjected to an annealing process, which involved heating to 95°C for 5 minutes, followed by cooling to 4°C at a rate of -1°C per minute.
After annealing, 1.0 µL of loading buffer was added to and mixed with each sample. A 10% polyacrylamide gel (polymerized with 0.1% TEMED and 0.1% APS) was prepared, and the samples were loaded onto the gel. Electrophoresis was conducted at a constant voltage of 100 V for 50 minutes. Following the run, the gel was stained with SYBR Gold, and the mobility of the bands was observed under UV illumination.
Result
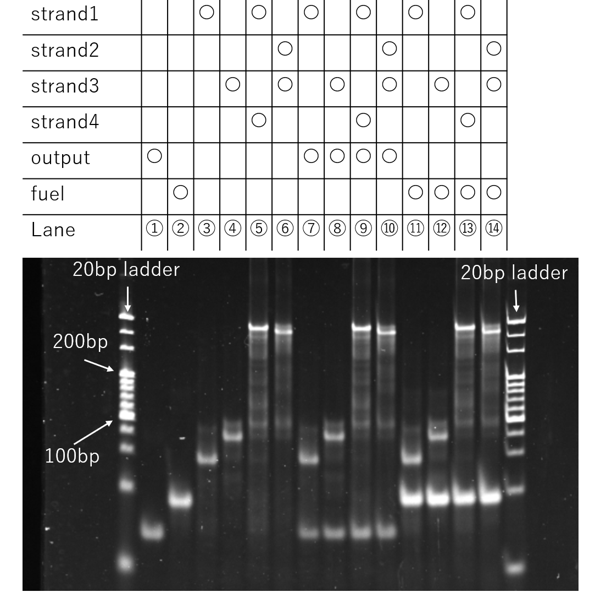
Figure 12a. PAGE Result
A comparison of the bands in lane 5 versus 9, and lane 6 versus 10, revealed no visible changes in either their position or intensity. The results show that even after the annealing process, the band indicating the binding of the motif DNA is still observed, while no new band corresponding to the binding of the Output strand to a motif DNA strand was detected. This suggests that the intended reaction did not proceed, even under conditions that were designed to favor the formation of a complementary duplex with the Output strand.
A possible explanation for this outcome is that the observed binding between the DNA motifs is not due to the intended sticky-end interactions (14 bases), but rather to the formation of a more stable duplex between the much longer arm regions (34 bases). Thermodynamically, the arm-to-arm binding would be more stable due to its greater length. If the motifs are binding via their arm regions, the sticky ends would not be involved in the primary interaction. Consequently, the sticky-end bond targeted for displacement by the Output strand might not exist in the first place.
Next Step
In the next experiment, we will use DNA strands that consist solely of the sticky end sequence, with no arm regions. The purpose is to verify whether the intended binding and displacement reaction with the Output strand can occur. This will allow for an independent evaluation of the functionality of the sticky end sequence itself and the viability of the strand displacement reaction, isolating it from the potential interference of the arm regions. (Experiment 13)
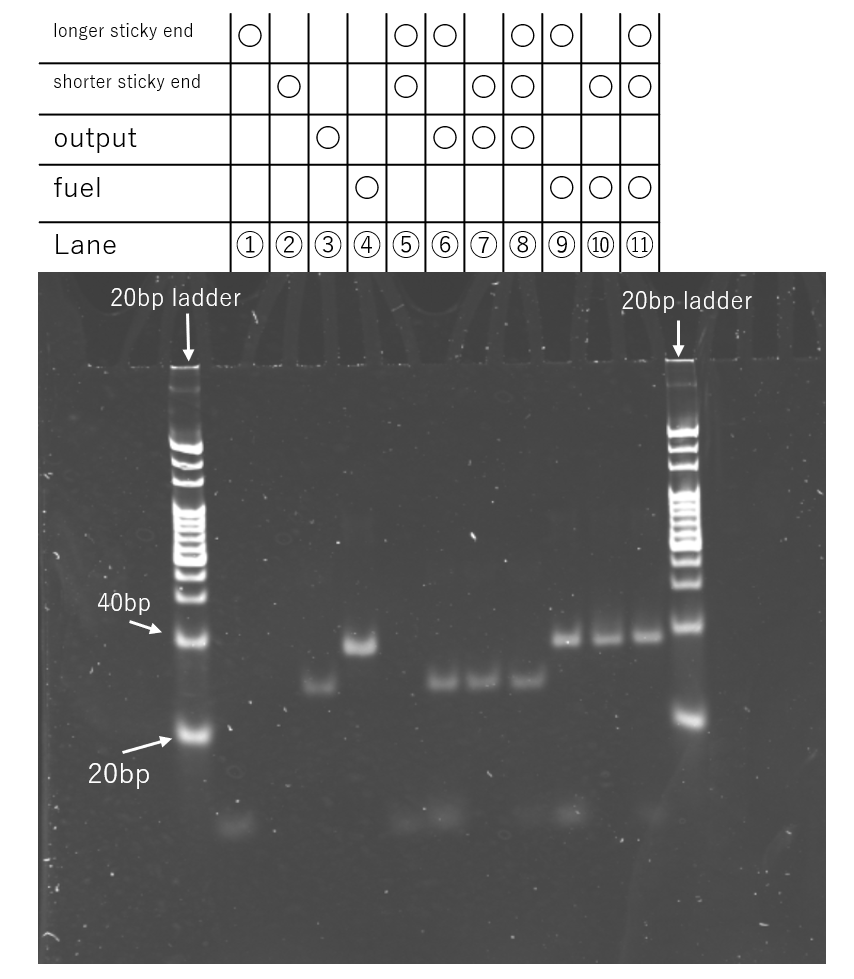
Experiment 13 : Output-Induced Displacement Analysis by PAGE(4th)
Objective
Building on the results of the previous experiment, the objective is to verify whether the Output strand can bind to its target by using a DNA strand that consists solely of the sticky end sequence.
Method
In this experiment, a total of 11 different samples were prepared at a volume of 5.0 µL each, as depicted in the results (Fig. 13a). For each sample, "short sticky end" strands, "long sticky end" strands, the Output strand, and the Fuel strand were added as required and mixed in a buffer containing 12.5 mM MgCl₂, 10 mM Tris, and 1.0 mM EDTA. The final concentration for each of the sticky end strands, as well as for the Output and Fuel strands, was adjusted to 0.25 µM. The detailed preparation procedure was identical to that described in Experiments 10-12.
A 10% polyacrylamide gel (polymerized with 0.1% TEMED and 0.1% APS) was prepared, and the samples were loaded onto the gel. Electrophoresis was conducted at a constant voltage of 100 V for 50 minutes. Following the run, the gel was stained with SYBR Gold, and the mobility of the bands was observed under UV illumination.
Result